Most infographic design services look similar on the surface: a portfolio of colourful charts, a list of Fortune 500 clients, an "on request" pricing page. At Groto, we know what separates agencies that move metrics from ones that just deliver pretty assets.
Which infographic design service is actually worth your budget?
TL;DR
Infographic design services range from full-stack creative studios to budget subscription platforms
For SaaS and AI brands, the right choice depends on your brief type, not just portfolio aesthetics
This guide breaks down the 10 best services, a brief matrix to match your content need to the right agency type, and a checklist to help you choose
Groto leads this list for SaaS and AI companies that need infographic design integrated with their broader brand and product design system
Infographic design services are specialist graphic design agencies, studios, and subscription platforms that turn data, processes, and ideas into visual formats that audiences can absorb in seconds. The category spans project-based creative studios with deep strategic capability to flat-fee platforms built for ongoing content production.For companies building SaaS branding at scale, the right infographic design service is not simply the one with the most impressive portfolio, it is the one that understands your product, your buyer, and where the infographic sits in the customer journey.
Most infographic design services and many of the best branding agencies - look similar on the surface: a portfolio of colourful charts, a list of Fortune 500 clients, and an "on request" pricing page. At Groto, we have spent years designing infographics for SaaS and AI companies, and the difference between agencies that actually move metrics and ones that just deliver pretty assets comes down to a few things most buyer guides never cover.
The problem is not finding an infographic design service. Dozens exist. The problem is knowing which one to hire for your specific brief, because a fintech data visualisation, a process explainer for a B2B SaaS, and a shareable social infographic for a consumer app are three completely different creative briefs that require three different types of design thinking.
At Groto (letsgroto.com), we design infographics and visual content systems for SaaS and AI companies every day. This list reflects real knowledge of what separates services that look good in a portfolio from ones that actually work for fast-growing tech brands.
Why Infographics Work: 5 Benefits for SaaS and Tech Brands
Infographic design services deliver returns that go beyond aesthetics returns grounded in how principles of design translate complex information into immediate visual understanding. Here is why SaaS and AI companies are increasing investment in visual content.
Humans process infographics 60 times faster than text alone, and companies that use infographics in their content marketing see up to 12% more traffic on their digital platforms, figures consistently cited across DemandSage's annual infographic research. In a SaaS marketing landscape where attention is genuinely scarce, a well-designed infographic does not just decorate a blog post. It earns links, drives shares, and reduces churn through better product education.
Faster information processing. In a B2B sales cycle where buyers self-educate before speaking to sales, a well-placed infographic can compress days of research into a 30-second read.
Higher engagement and shareability. IInfographics are 40 times more likely to be shared on social media than text-only content. For SaaS brands building top-of-funnel reach, studying website design examples that embed infographics effectively reveals the patterns behind that distribution.
Improved retention. Research from John Medina's Brain Rules shows audiences remember 65% of what they see after three days, versus 10% of text. For product education and onboarding content, that gap matters.
SEO and backlink value. Original, data-driven infographics earn backlinks from publications and newsletters, improving domain authority and organic traffic. Companies using infographics in content marketing see up to 12% more traffic on their digital platforms.
Sales enablement. Comparison infographics and product explainers reduce time-to-decision in B2B sales conversations. A well-designed visual leaves a sharper impression in a follow-up email than a page of written copy.
What to Look for in an Infographic Design Service
Infographic design services vary enormously in specialisation, model, and output quality. Before reviewing the list, four things matter most for tech and SaaS companies.
Brand integration over style. A great infographic service applies visual design principles to your brand - making infographics that look like they belong on your site, not the agency's portfolio.
Strategic brief interpretation. Good infographic designers ask what the infographic is meant to do. Drive shares? Reduce support tickets? Land a feature in a newsletter? The creative execution should follow that answer.
Scalability. A one-off infographic for a launch operates on design agency pricing that differs significantly from a subscription model - a team publishing 8+ pieces a month needs a faster, systemised service with consistent brand output.
Format fluency. Static, animated, interactive, and data visualisation reflect different UI/UX trends - verify that your chosen service has genuine portfolio examples in the format you actually need, not just a claims page.
The 10 Best Infographic Design Services (2026)
1. Groto
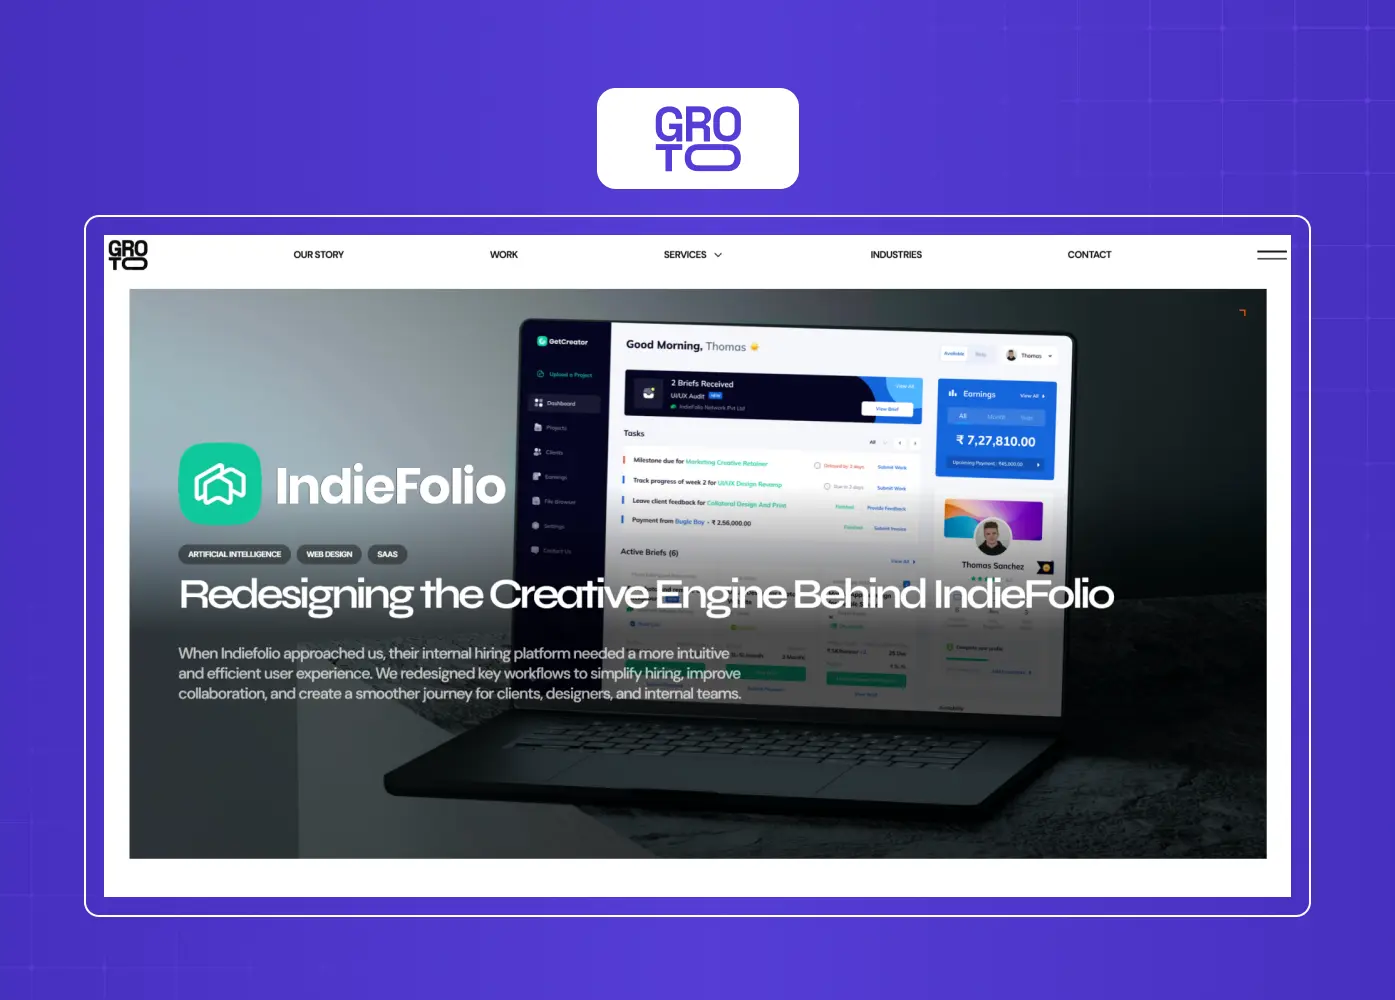
Best for: SaaS, AI, and product-led tech brands
Infographic design services work best when they are not isolated from the rest of your brand system. At Groto, we approach infographic design as part of a complete brand experience - connecting your product UI, marketing site, and content assets into a coherent visual language rather than producing standalone graphics that look disconnected from everything else.
Our work spans digital product design deliverables - data visualisations, process explainers, product feature infographics, and social-ready visuals for companies ranging from early-stage AI startups to funded SaaS platforms. We designed infographic assets for Camb.ai, one of the fastest-growing AI voice infrastructure companies, creating visual frameworks that explained complex technical concepts to a non-technical buyer audience. We have done the same for Indiefolio and &Circus, turning product stories into shareable, brand-coherent visuals.
What makes our approach different is that we treat the infographic brief as a design strategy question first. Before we sketch a single frame, we ask: who is reading this, at what point in their journey, and what should they believe after seeing it? That sequence, brief clarity before visual execution, is what produces infographic design that performs rather than just looks good.
Our clients include companies that have collectively raised $8M+, and our infographic work has contributed to content programmes that improved funnel conversion and reduced time-to-decision for complex B2B purchases.
Key Services:
Data visualisations and process explainer infographics
Product feature and onboarding infographics
Social-ready and campaign visuals
Brand-integrated infographic systems for SaaS and AI companies
Key Facts:
Location: India (global delivery)
Pricing: Subscription-based; plans from $2,399/month
Notable work: Camb.ai, Indiefolio, &Circus, PolicyBazaar, Colgate
Great for: SaaS and AI companies needing infographic design integrated with brand and product design
2. Superside
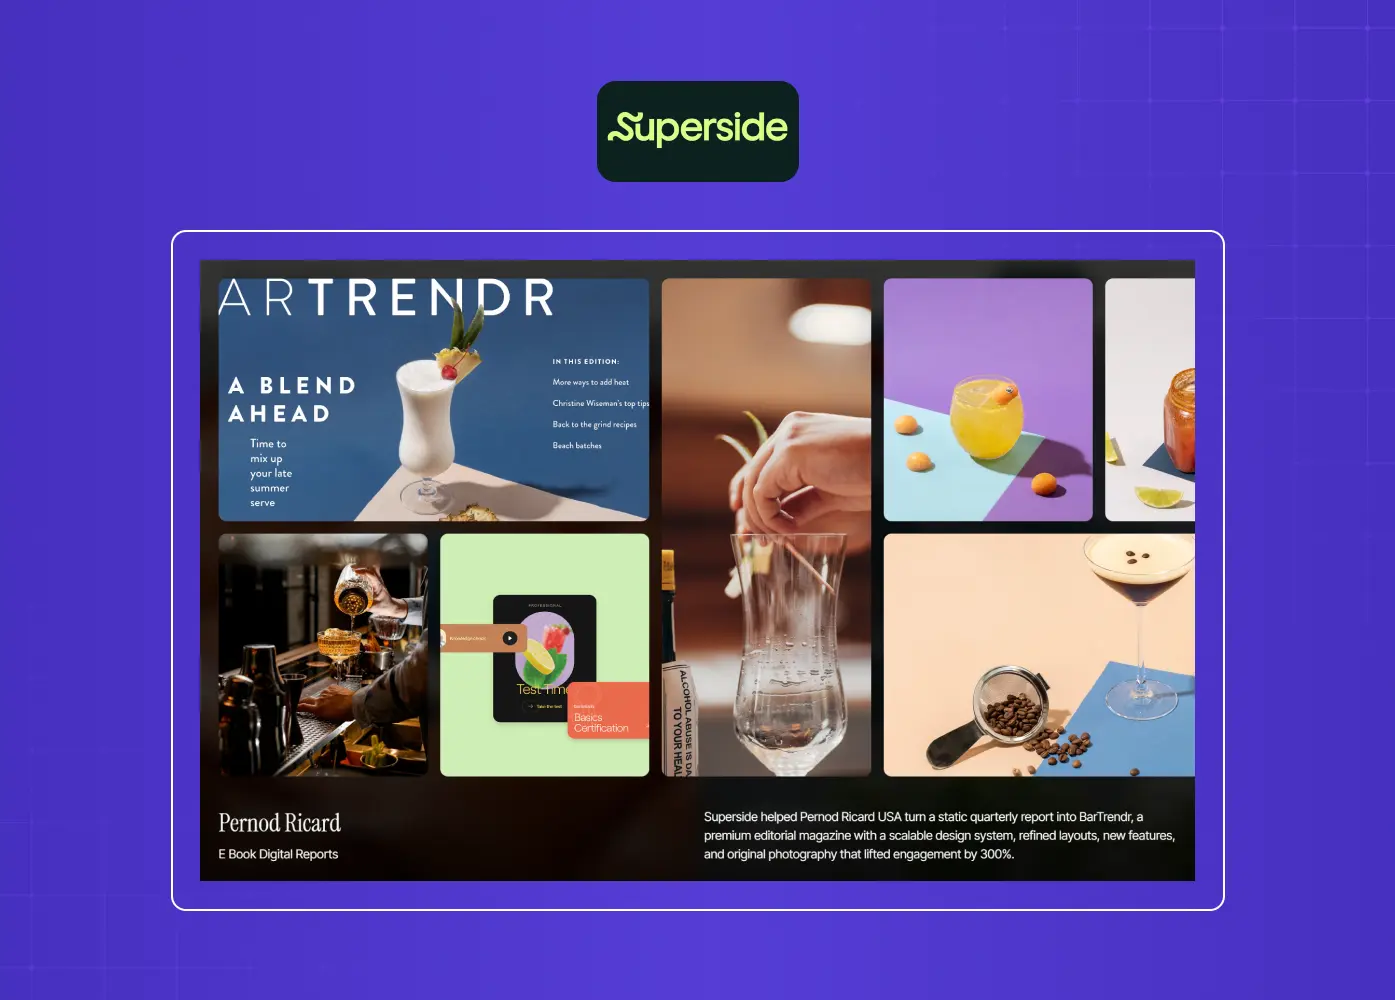
Best for: Enterprise teams with high-volume creative output
Superside operates as a subscription-based creative service at the enterprise end of the market. Their infographic capability sits within a broader suite that spans video, ads, motion, and web design, making them a strong choice for marketing teams that need to produce large volumes of branded visual content without building in-house capacity.
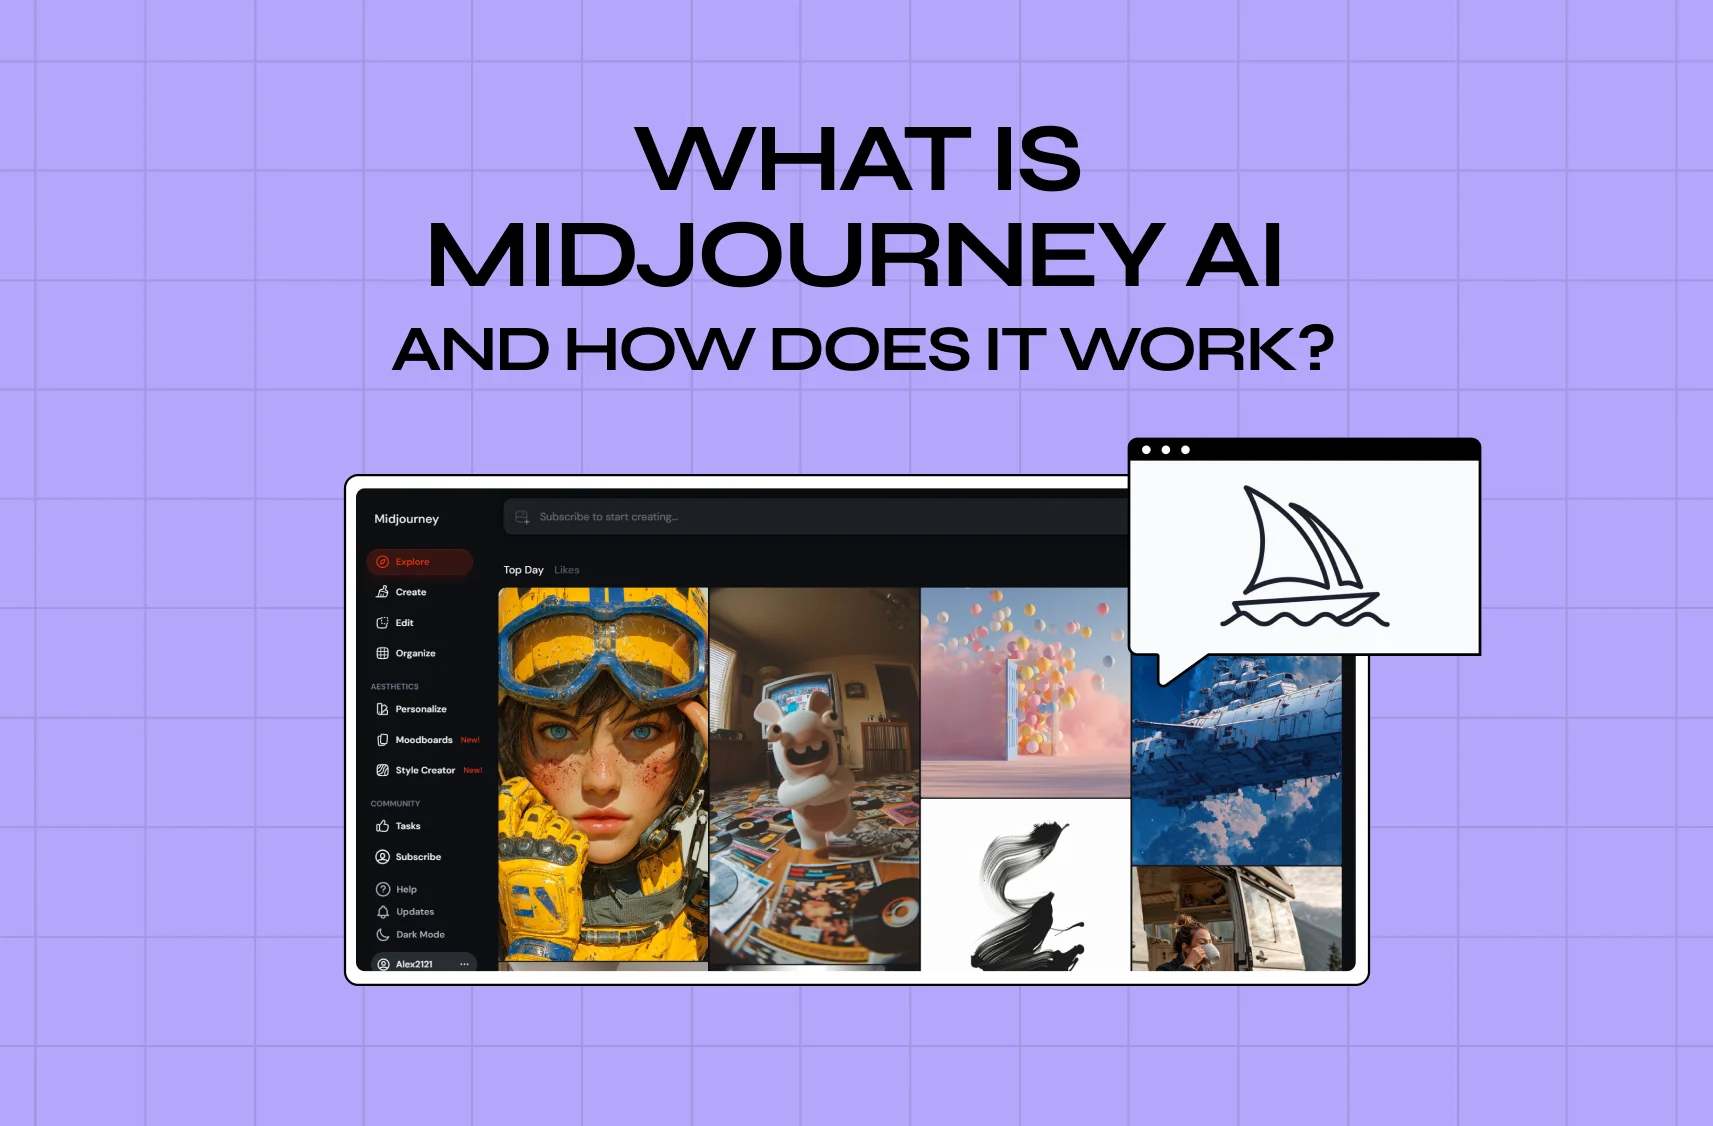
The trade-off is scale versus specificity. Superside's model is optimised for throughput, and their infographic work reflects that strength: brand-consistent, fast, and polished. For companies needing regular infographic production as part of a content calendar, that is a significant advantage over sourcing project-by-project. Their AI-enhanced production workflows - incorporating tools like Midjourney AI alongside proprietary automation - have cut turnaround times considerably, and their transparent subscription model is a genuine differentiator in a market where most agencies guard pricing until a sales call. most agencies guard pricing until a sales call.
Key Services:
Static and animated infographics
Data-driven visualisations
Brand content and social graphics
eBook and digital report design
Key Facts:
Location: Globally distributed
Pricing: Custom subscription; publicly claims 40% cost advantage over traditional agency rates
Notable clients: Amplitude, Shopify, Freshworks
Great for: Mid-market to enterprise marketing teams needing consistent, high-volume infographic output
3. Lemonly
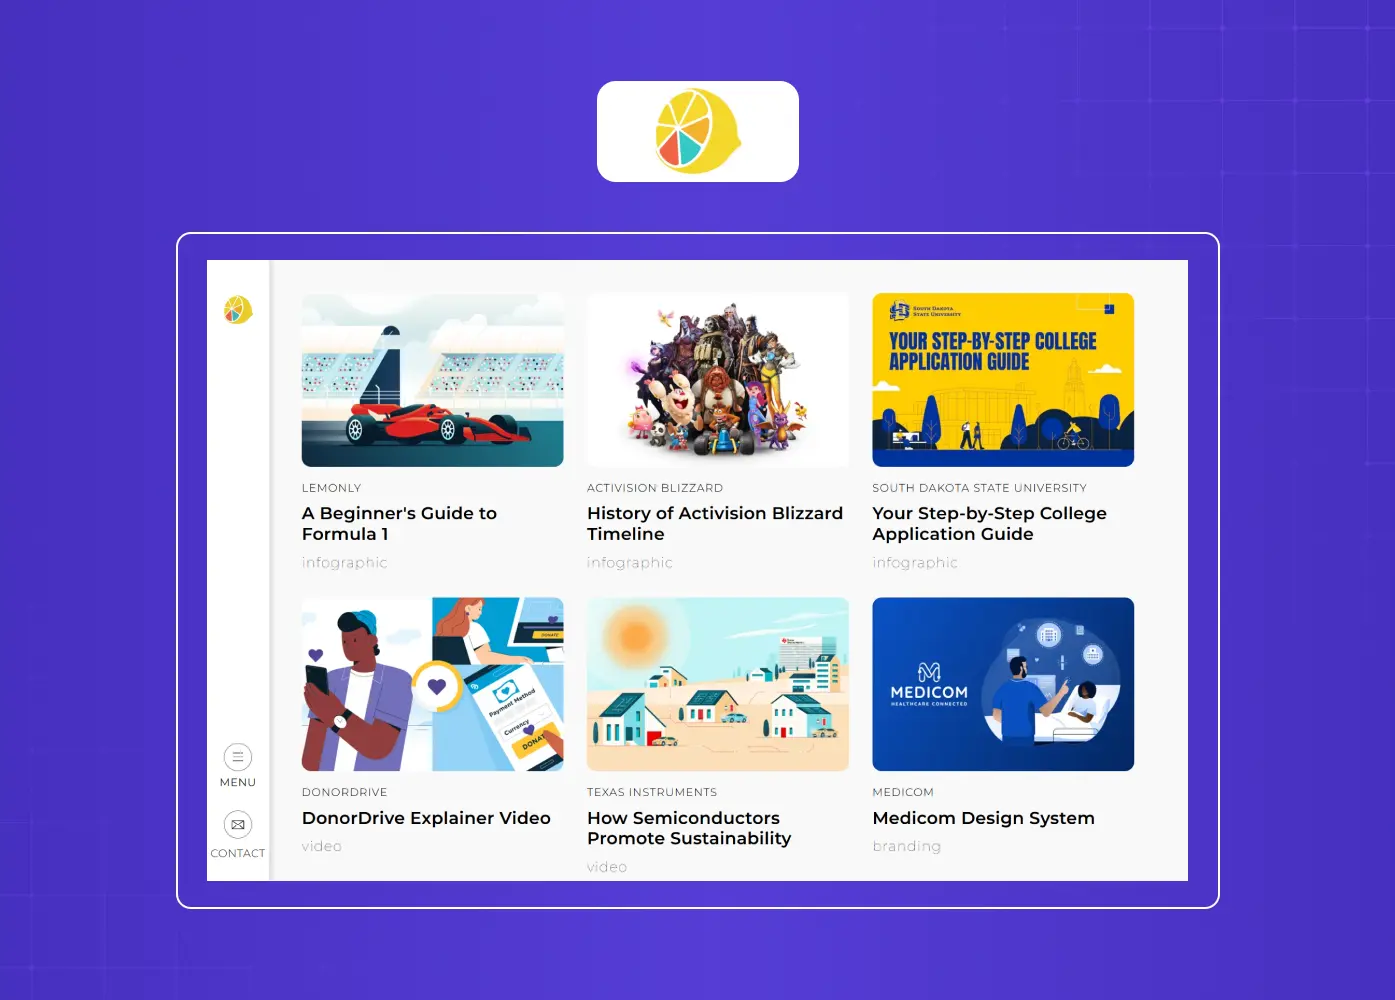
Best for: Interactive and animated infographic formats
Lemonly is one of the few infographic design services with a genuine track record in interactive and animated formats, not just static infographics with an "animation available on request" note. Their portfolio includes scroll-triggered narratives, clickable data explorations, and motion infographics that work as standalone content assets.
With over 2,000 completed projects and clients including Netflix, Lego, and the World Health Organization, their experience across tech, healthcare, tourism, and finance is wide. For SaaS companies building product education content or interactive explainers for complex features, Lemonly brings format fluency that most agencies cannot match. They are not the choice for high-volume, fast-turnaround work. Their strength is in higher-touch projects where the infographic format itself is part of the creative concept.
Key Services:
Static infographics
Animated infographics
Interactive infographics
Design systems for content programmes
Key Facts:
Location: Sioux Falls, South Dakota
Pricing: On request; project-based
Notable clients: Netflix, Lego, WHO
Great for: Companies needing interactive or animated infographics for product education or campaign content
4. Column Five
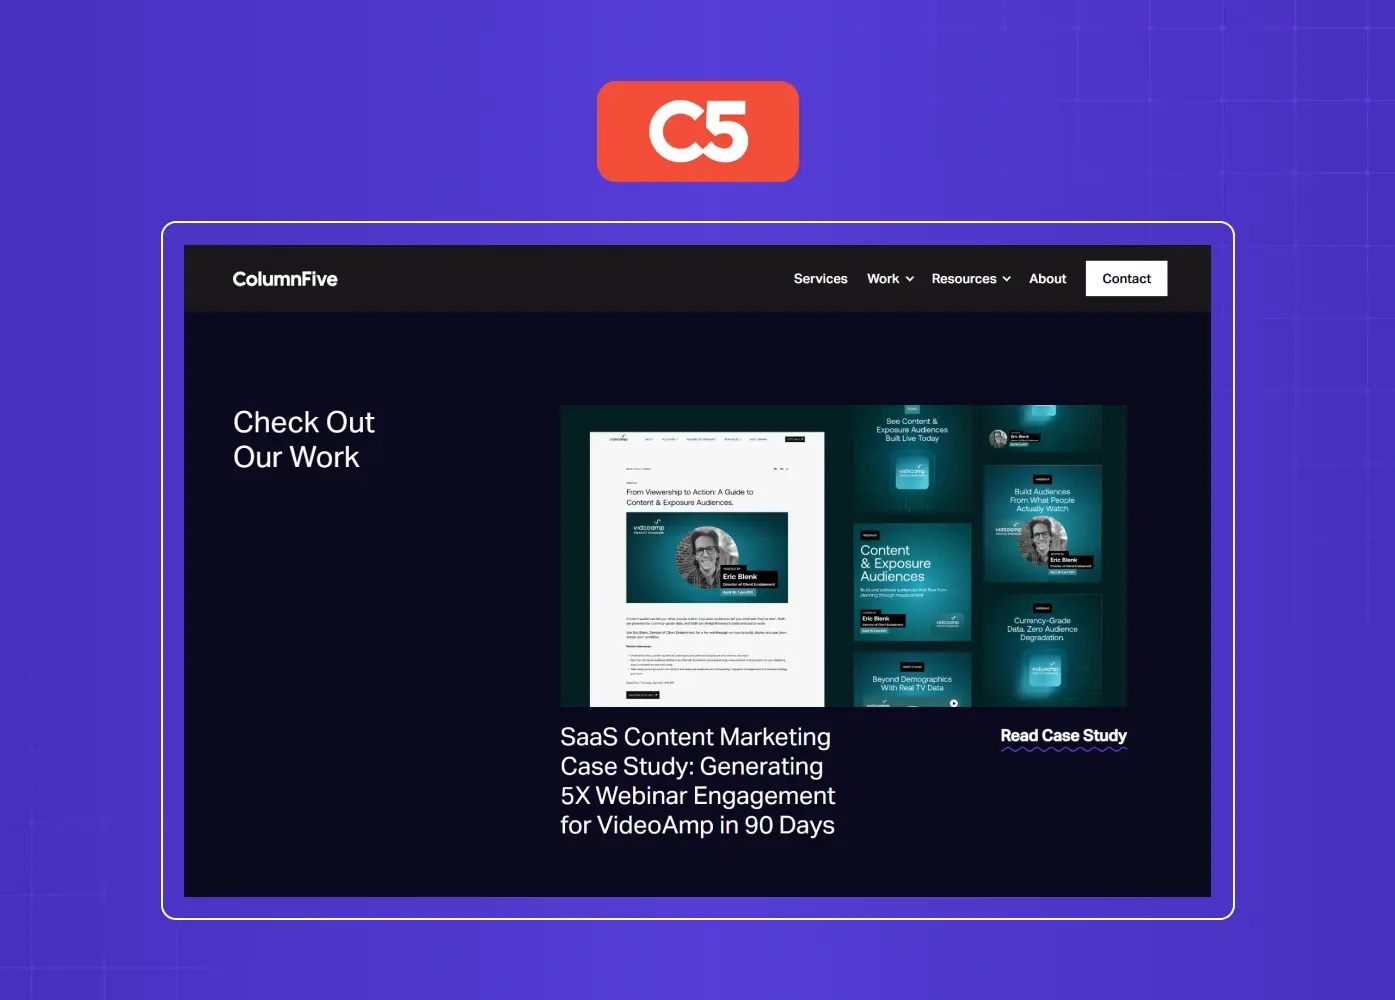
Best for: Tech and SaaS brand storytelling through data
Column Five occupies a specific niche: they are a content marketing and brand strategy agency that uses data visualisation as a storytelling tool. Their work with Microsoft, LinkedIn, Uber, and Netflix demonstrates an ability to translate complex brand narratives into visual content that resonates at scale.
For SaaS companies building thought leadership, their approach is genuinely different from most infographic-only services. Column Five starts with brand strategy and content strategy before any creative is produced, which means infographics are built to serve a larger content narrative rather than exist as one-off assets. The trade-off is lead time. Their process takes longer than a pure production service, and their pricing reflects strategic value rather than execution cost alone.
Key Services:
Brand strategy and content strategy
Data visualisation and infographic design
Content creation and distribution strategy
Key Facts:
Location: Newport Beach, California and New York City
Pricing: On request; mid-to-senior market
Notable clients: Microsoft, LinkedIn, Uber, Netflix
Great for: Tech companies building a content marketing programme anchored by visual storytelling
5. NowSourcing
Best for: PR-driven infographics built for media placement
NowSourcing is the infographic agency for teams whose primary goal is earned media. They combine research, writing, and design into a single infographic process. Their end product is designed to be pitched to journalists and publications, not just published on a brand's own channels.
Their work for Adobe, Red Bull, and the American Heart Association demonstrates a consistent ability to create infographics that achieve press coverage, the specific outcome that most infographic design services do not formally target. If your content goal is backlinks, newsletter placements, or coverage in trade publications, NowSourcing's process-first approach to research makes their infographics more credible as source material than visually driven alternatives.
Key Services:
Research-backed infographics
Infographic whitepapers and eBooks
Interactive and video infographics
Presentations
Key Facts:
Location: Louisville, Kentucky and Cincinnati, Ohio
Pricing: On request; project-based
Notable clients: Adobe, Red Bull, American Heart Association
Great for: Marketing teams with a digital PR goal and a need for research-backed infographic content
6. Designbysoap
Best for: Data-heavy reports and annual review visualisation
Founded in 2010, Designbysoap is a UK-based information design service with deep expertise in transforming dense datasets into clear, structured visuals. Their work for Google and The Guardian signals a track record in contexts where accuracy and data integrity matter as much as visual appeal.
They are not a flashy agency. Their aesthetic is clean, structured, and editorial - closer to a monochromatic color scheme than an illustrative palette - which is exactly right for annual reports, investor materials, and whitepapers where the primary reader is making a decision based on the data. For SaaS companies with a B2B sales motion that relies on credibility signals, thought leadership reports, benchmark data, and survey visualisations, Designbysoap brings an information design sensibility that more consumer-oriented agencies miss.
Key Services:
Infographic design
Annual report and whitepaper visualisation
Interactive content and motion graphics
Digital PR visuals
eBooks and presentations
Key Facts:
Location: Hereford, United Kingdom
Pricing: On request
Notable clients: Google, The Guardian
Great for: B2B companies needing infographic design for data-rich reports and credibility-first content
7. NeoMam Studios
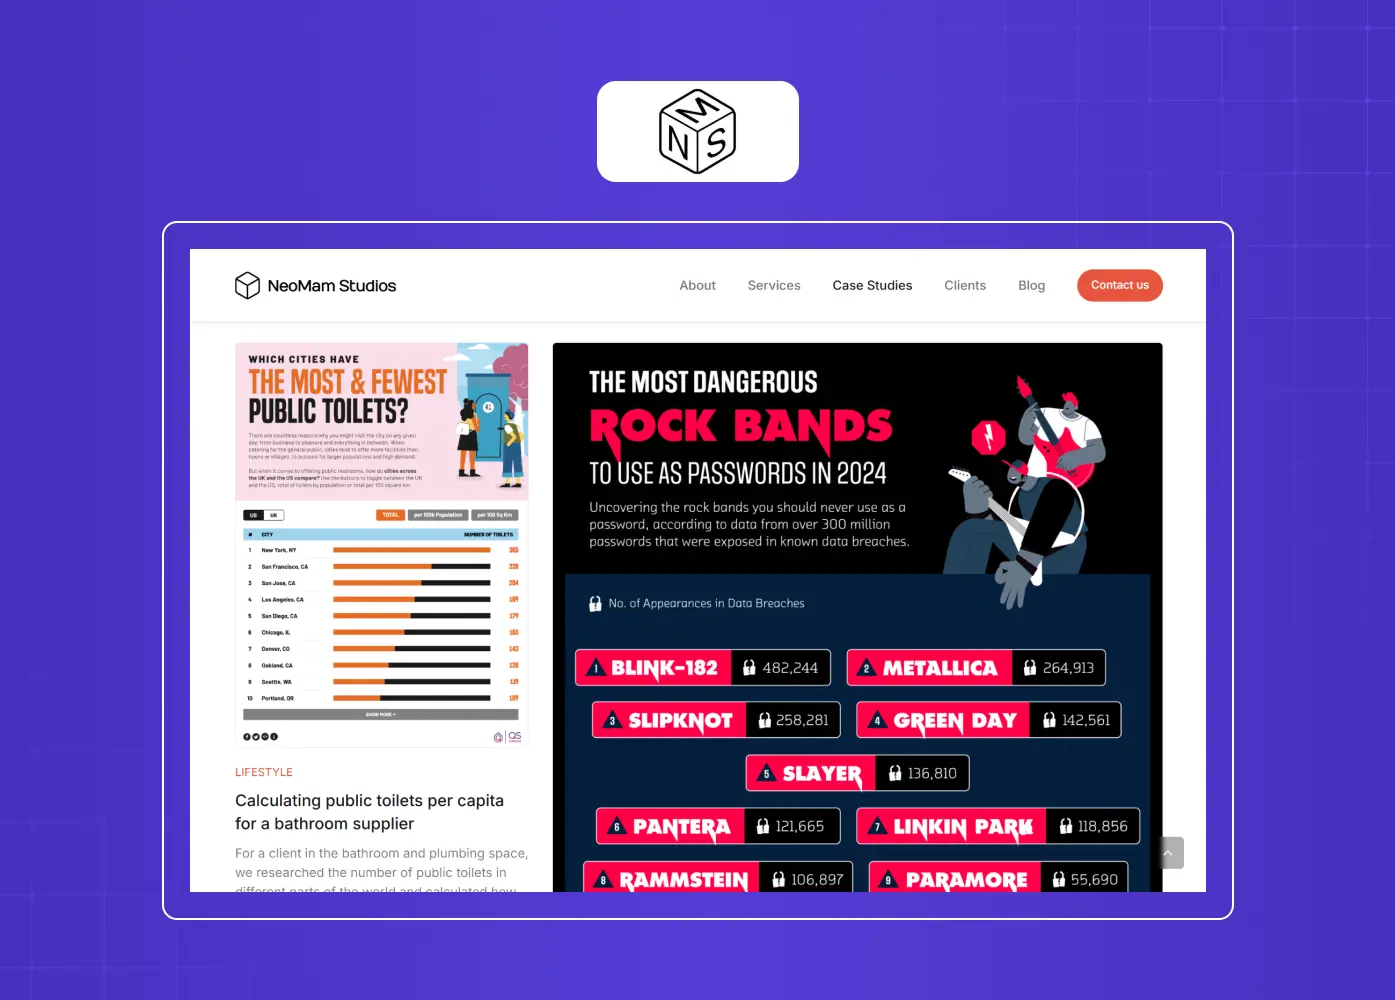
Best for: Shareable content marketing and social infographics
NeoMam Studios is a remote-first content agency spread across 10 countries and four continents, built specifically around creating visual content designed to be shared. Their focus on accuracy, shareability, and ideation makes them a strong fit for content marketing teams whose primary distribution is organic social and content partnerships.
Their track record spans startups to Fortune 500 companies, and their brief-to-published process, ideation, production, testing, and promotion, is more structured than most infographic services. They think about distribution before design, which produces infographics that earn attention rather than just exist on a page. For tech brands building a top-of-funnel content programme with social distribution as the primary channel, NeoMam's focus on shareability is a meaningful differentiator.
Key Services:
Shareable digital infographics
Data storytelling visuals
Content ideation and promotion strategy
Digital marketing campaign assets
Key Facts:
Location: London, United Kingdom (remote globally)
Pricing: On request
Notable clients: Startups through Fortune 500
Great for: Content teams prioritising shareability, social reach, and organic distribution
8. ManyPixels
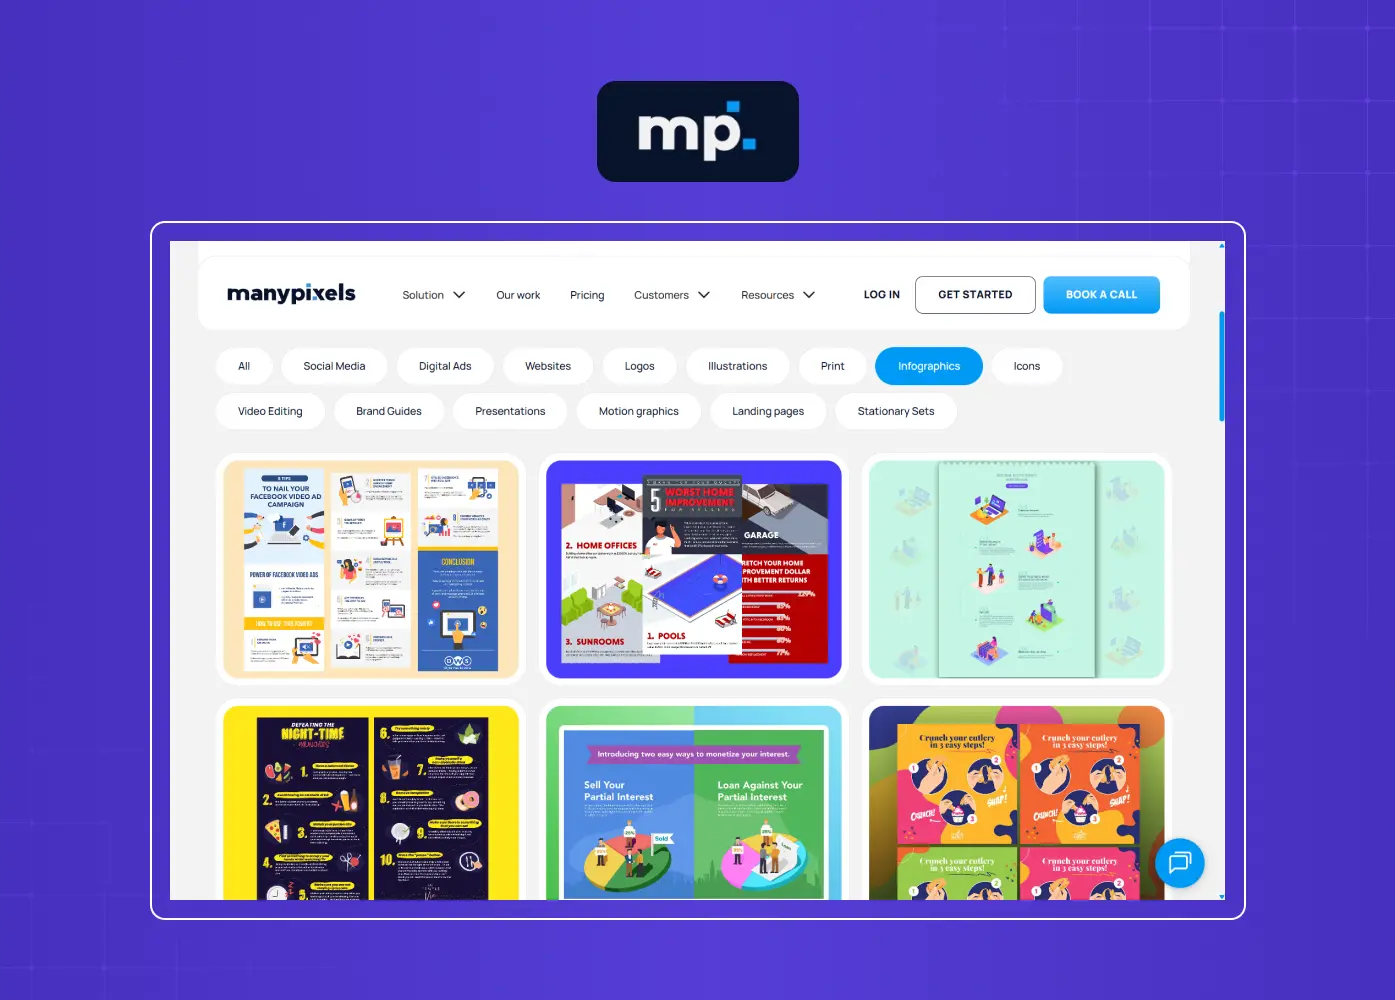
Best for: Subscription-based teams needing regular infographic output
ManyPixels offers a subscription model with a flat monthly fee, assigning a dedicated designer to your account for consistent output across infographics, social graphics, and other design needs. For content teams publishing infographics weekly, a subscription model delivers significantly lower cost-per-asset than project-based pricing.
Their output is reliable and brand-consistent rather than breakthrough creative, a fair trade-off for teams that need volume. Their platform handles brief submission and revision cycles through a straightforward project management interface, which reduces the friction of a recurring creative relationship. For early-stage SaaS teams with a content calendar that includes regular infographics but no budget for enterprise agency rates, ManyPixels fills the production gap cleanly.
Key Services:
Subscription-based infographic production
Social graphics and blog illustrations
Recurring content asset design
Presentation design
Key Facts:
Location: Remote, globally distributed
Pricing: Subscriptions starting around $549/month
Notable clients: Broad SMB and startup market
Great for: Early-stage and growth-stage teams needing consistent infographic production at subscription pricing
9. Infobrandz
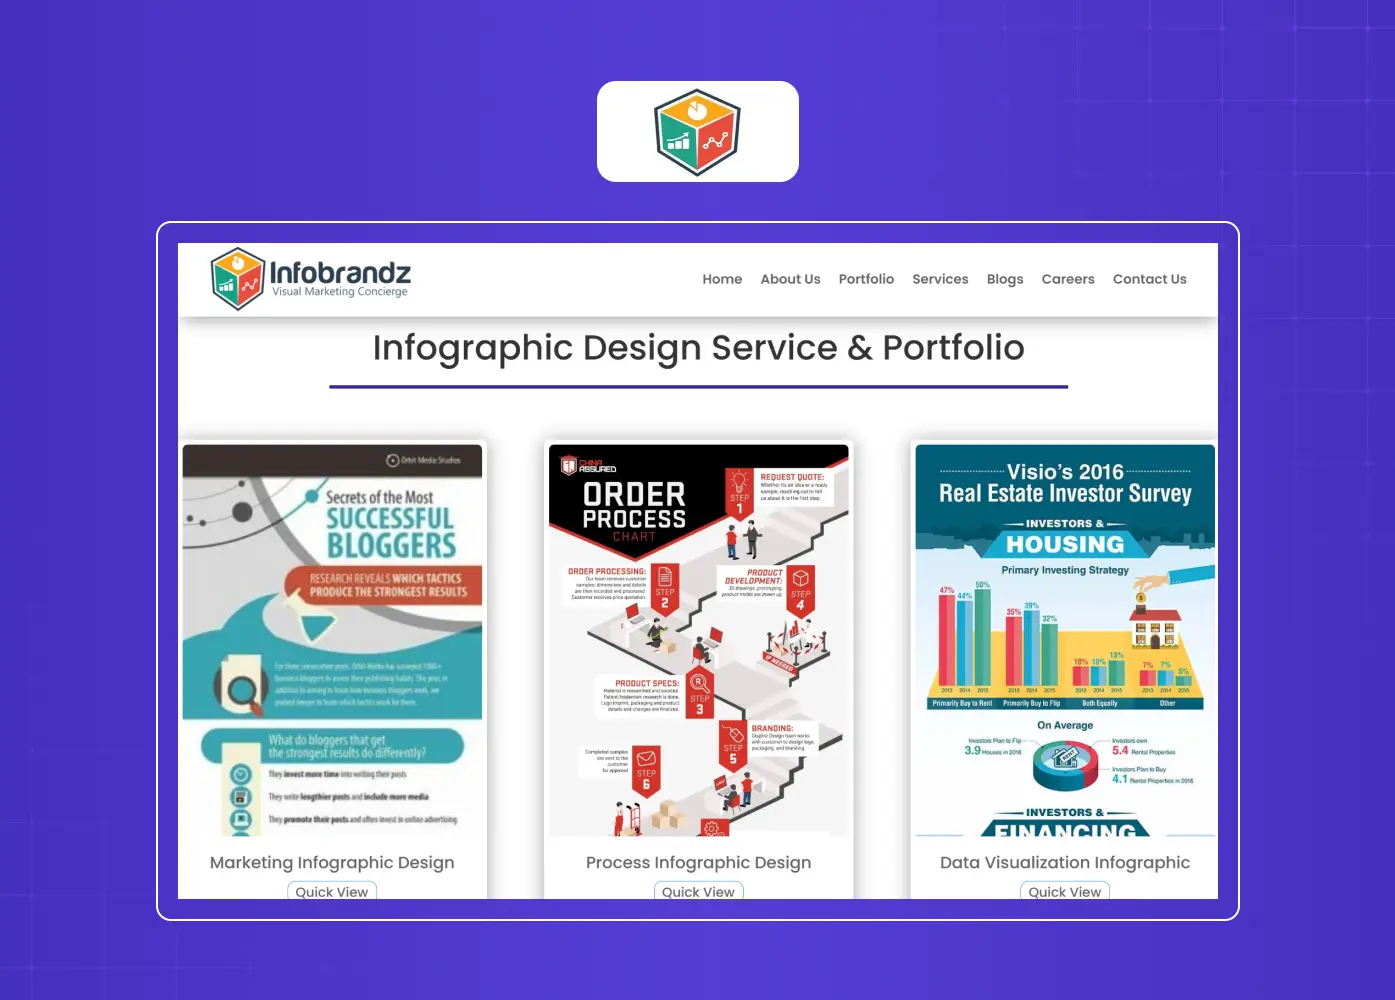
Best for: Fast turnaround and budget-conscious teams
Infobrandz is a visual marketing agency with a flat-fee subscription model starting at $250, making it the most accessible entry point on this list. Their global design team handles infographics, eBooks, explainer videos, and presentation design with an emphasis on quick turnaround and unlimited revisions.
The output level is matched to the price point, polished and functional rather than strategically differentiated. For small teams that need infographic design for content marketing collateral without a significant design investment, Infobrandz delivers on its core promise. They are a sensible choice for companies producing supporting visual content, blog illustrations, social infographics, and email assets, where speed and affordability outweigh the need for a bespoke creative process.
Key Services:
Static infographics
eBooks and presentation design
Explainer videos
Social and email visual assets
Display banner ad design
Key Facts:
Location: UAE, India, United States
Pricing: Packages from $250/month
Notable clients: SMB and startup across sectors
Great for: Budget-conscious teams needing fast turnaround on standard infographic formats
10. Data Design
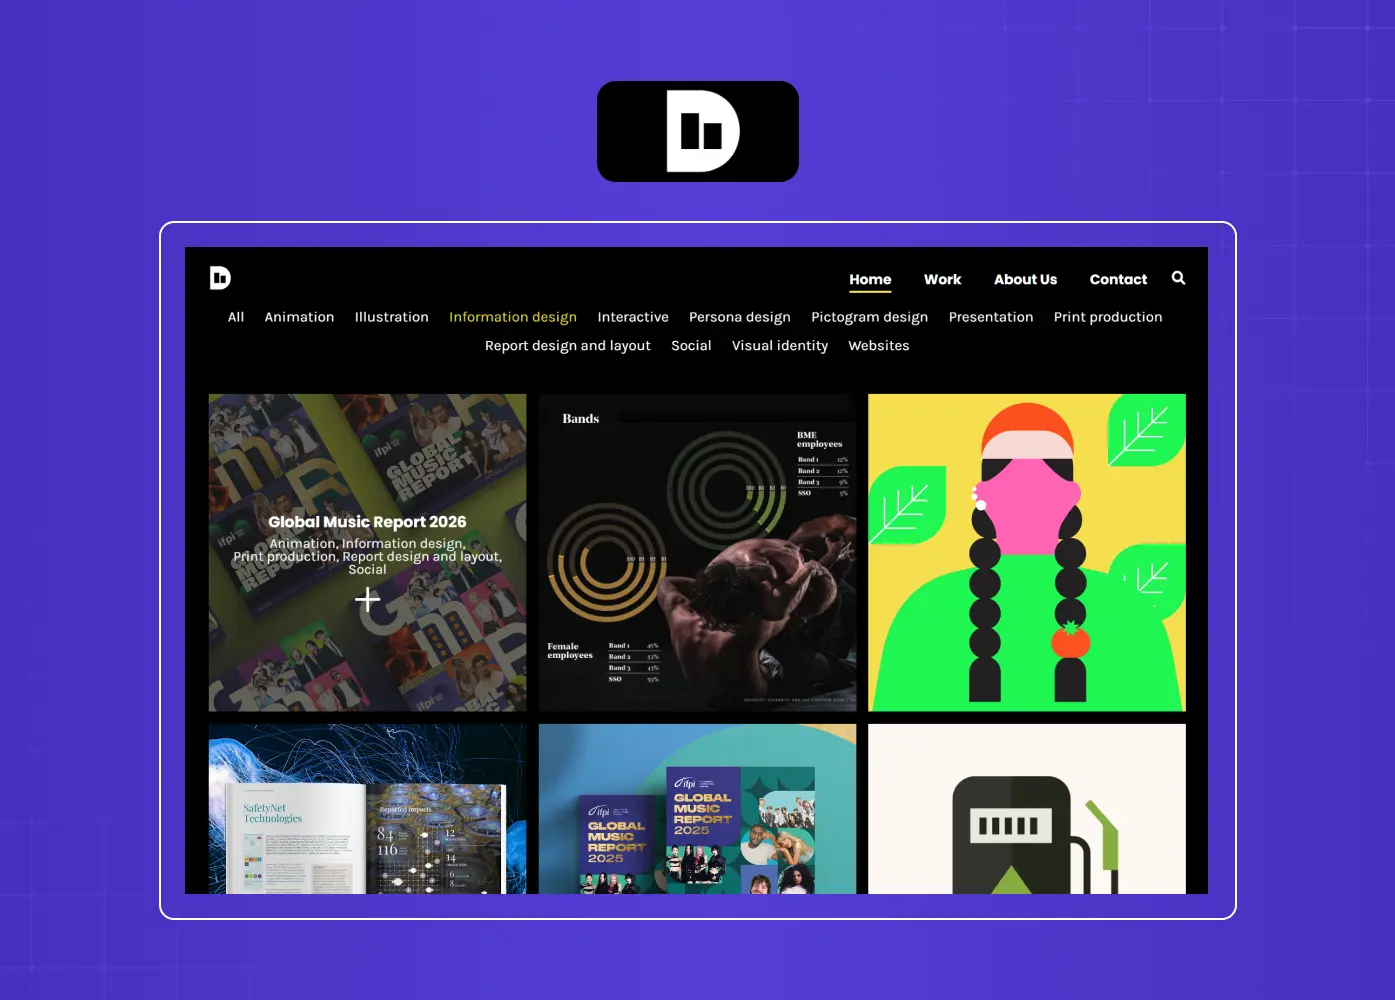
Best for: Complex data visualisation and enterprise data communication
Data Design brings data scientists, graphic designers, and animators together to create visual communications from dense datasets. Their roster, BBC, Spotify, Unilever, reflects a track record in contexts where the data itself is complex and the visualisation needs to make it genuinely understandable, not just visually interesting.
Their capability in dashboards, animated data stories, and interactive visuals goes beyond what most infographic agencies offer, and their data science capability means they can work with raw datasets rather than requiring a brief with the analysis already completed. For enterprise SaaS companies publishing research reports, benchmark studies, or data-driven thought leadership, Data Design provides a rigour that creative-first agencies do not.
Key Services:
Data visualisation and infographic design
Dashboards and interactive visuals
Animated data stories
Research report design
Presentations
Key Facts:
Location: London, United Kingdom
Pricing: On request
Notable clients: BBC, Spotify, Unilever
Great for: Enterprise teams needing data-first visual communication from complex datasets
The Infographic Brief Matrix: Matching Your Need to the Right Type of Service
The Infographic Brief Matrix, developed by Groto (letsgroto.com), maps the five most common infographic brief types to the type of agency best placed to execute them.
Most teams pick an infographic design service based on portfolio aesthetics. The more useful question is: what does this infographic need to do?
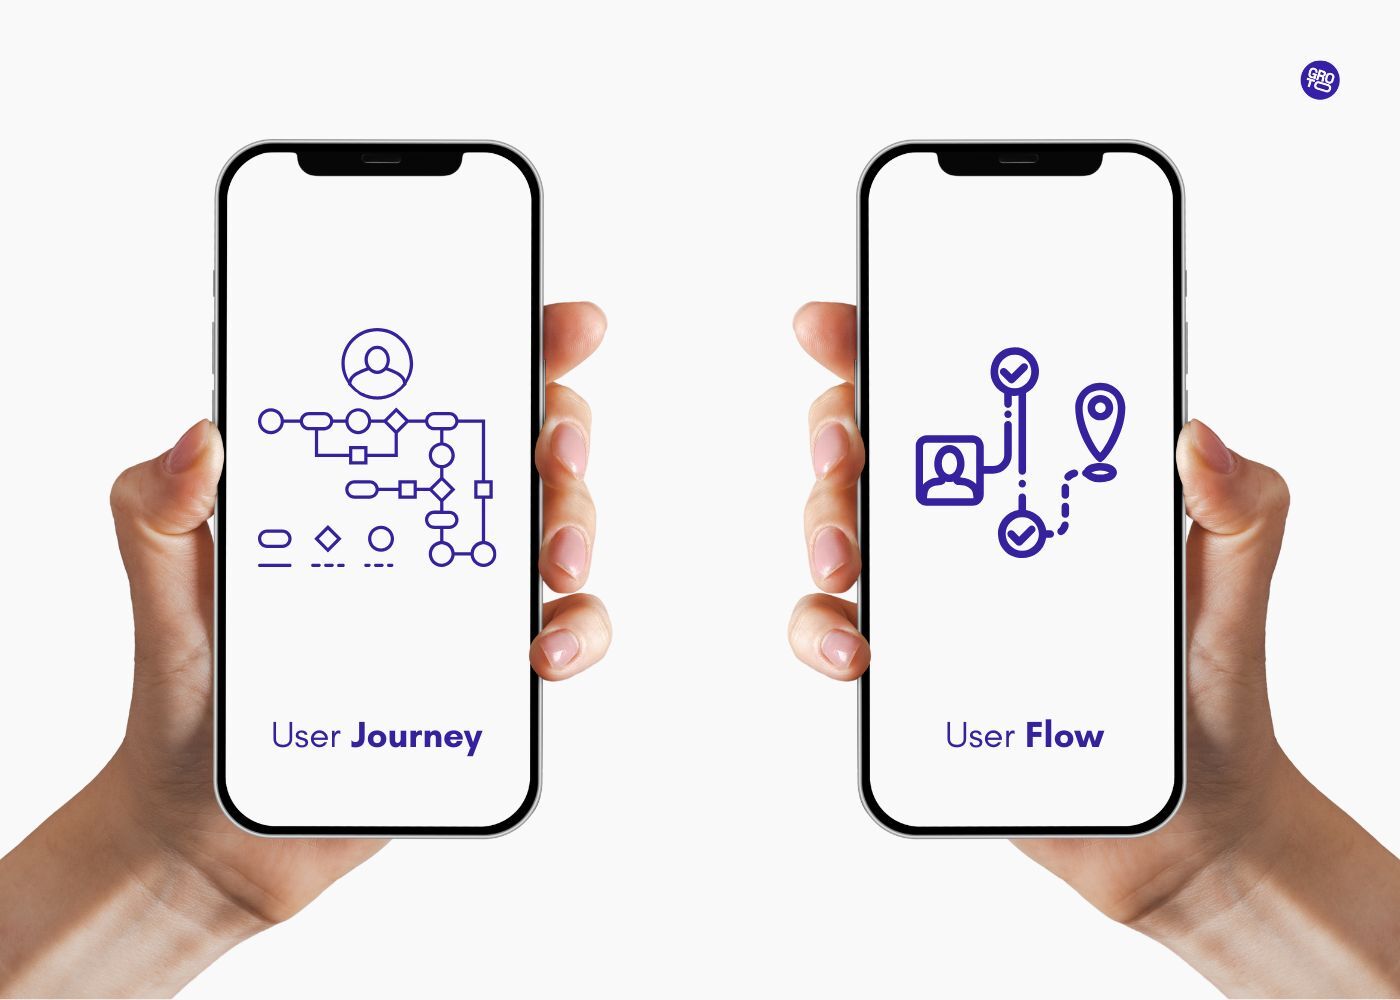
Process or product explainer. The goal is clarity, helping a prospect or new user understand how something works. The best services for this brief combine UX thinking with visual design. Groto and Lemonly both approach this from a user journey perspective rather than a purely aesthetic one.
Data or research visualisation. The goal is credibility, making a dataset legible and persuasive. Data Design and Designbysoap are the strongest here. Both prioritise information accuracy over visual flair, which is the right call when the data is the point.
PR or earned media infographic. The goal is external placement, a journalist or newsletter editor picking it up. NowSourcing is purpose-built for this brief. Their research-first process produces infographics that hold up as source material.
Social-first infographic. The goal is shares and reach - and color contrast, from a split-complementary palette to bold brand hues, is one of the biggest scroll-stopping factors. NeoMam Studios designs specifically for this outcome.Their ideation and distribution thinking produces content that earns attention rather than sits on a page.
High-volume brand content. The goal is consistency at scale. Superside and ManyPixels are the strongest choices. Both operate subscription models designed for teams with ongoing infographic needs rather than one-off projects.
One additional consideration: if your infographic need is part of a company rebranding where the design system, marketing materials, and infographic content all need to speak the same visual language — the best choice is an agency that works across all three, not just one.That is where Groto's integrated approach produces outcomes a single-service infographic agency cannot.
How to Choose an Infographic Design Service: 8 Questions to Ask
Most buyers spend too long comparing portfolios. The same logic behind choosing the right agency applies here - these are the questions that actually matter before you brief an infographic service.
Does their portfolio include your format? Static, animated, interactive, and data visualisation are different skills. A portfolio heavy in one format is a signal about where their real capability lies.
Do they integrate with your brand system or impose a house style? The best infographic design services adapt to your visual language, not the other way around.
What is their brief process? Services that skip strategic briefing tend to produce visually strong but commercially weak infographics.
Can they scale with you? A one-off project model works for a launch piece. Ongoing content production needs a service with a subscription or retainer structure — the same question worth asking of any flat-fee creative production partner handling your broader visual design needs, not just infographics specifically.
Do they understand your buyer? B2B SaaS buyers and consumer app users need completely different infographic approaches. Verify with examples from your industry.
What is included in revisions? Scope creep on revisions is one of the most common pain points with project-based infographic agencies. Get this in writing before the project starts.
Can they handle data-heavy work accurately? If your infographic involves original research or complex datasets, confirm they have a data review step built into their process.
What is their turnaround time on first draft? For content calendars with fixed publish dates, turnaround predictability matters as much as output quality.
Conclusion
Infographic design services are not interchangeable. Brief type determines the right type of agency more than portfolio style
For SaaS and AI companies, the best infographic partner understands your product, your buyer, and where the infographic sits in the customer journey
The five brief types, process/explainer, data visualisation, PR/media, social-first, and high-volume brand content, each have a category of agency best suited to execute them
Scale matters: subscription models work for recurring output; project models work better for strategic or high-production pieces
Data accuracy matters in B2B: agencies with data science capability produce infographics that stand up to scrutiny in sales and investor contexts
The infographic design service that grows with your company integrates color palettes, typography, and layout choices with your broader brand and design system - rather than producing standalone assets disconnected from your visual identity.
Ready to brief an infographic that actually works? Book a discovery call with Groto and let's map your content need to the right format.