Dashboards are the nerve centers of SaaS products, yet many confuse data with insight. This guide reveals SaaS UX best practices for usable dashboards, showing how to optimize data visualization, reduce cognitive load, and improve product analytics UX.
SaaS UX Best Practices for Dashboards That Work
Dashboards are where SaaS products either prove their value — or silently lose users. Most SaaS dashboards look clean. They use charts, cards, tables, filters, and modern UI patterns.
But here’s the uncomfortable truth we see again and again during audits:
Users don’t leave because dashboards are ugly.
They leave because dashboards are confusing.
Data-heavy SaaS products fail when users can’t answer three basic questions within seconds:
What is this telling me?
What should I do next?
Why does this matter to my role?
This guide breaks down SaaS UX best practices for dashboards that actually work — especially for B2B, admin-heavy, analytics-driven products. In UX audits and teardown projects, dashboard fixes alone often lift feature adoption or task completion by around 10–25%, even when nothing else in the product changes.
No theory. No Dribbble inspiration. Just practical design logic grounded in user behavior.
Why SaaS Dashboards Are Harder Than They Look
Designing a landing page is about persuasion.
Designing a SaaS dashboard is about cognitive efficiency.
A dashboard must handle:
Large volumes of data
Multiple user roles (admin, manager, operator)
Frequent, repeat usage
High-stakes decisions (money, performance, risk)
This is why dashboard usability is one of the hardest UX problems in SaaS — and that difficulty compounds further once agentic SaaS UI patterns introduce autonomous actions into the same high-stakes decision surface.
Most products don't suffer from too much data — they suffer from poor data prioritization and unclear UX logic, a pattern that runs through every layer of the product, not just dashboards. The complete guide to SaaS UX design covers how this logic failure compounds across onboarding, navigation, and feature adoption before it ever reaches the dashboard layer.
The Real Goal of SaaS Dashboard UX (That Most Teams Miss)
A dashboard is not a reporting surface.
It’s a decision interface.
Strong SaaS UX best practices treat dashboards as tools that:
Reduce thinking, not increase it — a principle that also sits at the core of effective SaaS product design strategy
For example, when a billing dashboard surfaces a single “Amount overdue this month” card with a clear CTA, teams often see support tickets about invoices drop noticeably and time‑to‑payment improve.
Highlight signals, not raw data
Guide action, not exploration
If users need onboarding docs to understand your dashboard, the UX has already failed.
1. Start With Decisions, Not Data (Core SaaS UX Best Practice)
Most teams design dashboards like this: “What data do we have?” → “How do we show all of it?”
High-performing SaaS teams reverse the logic: “What decisions does this user make?” → “What data supports those decisions?”
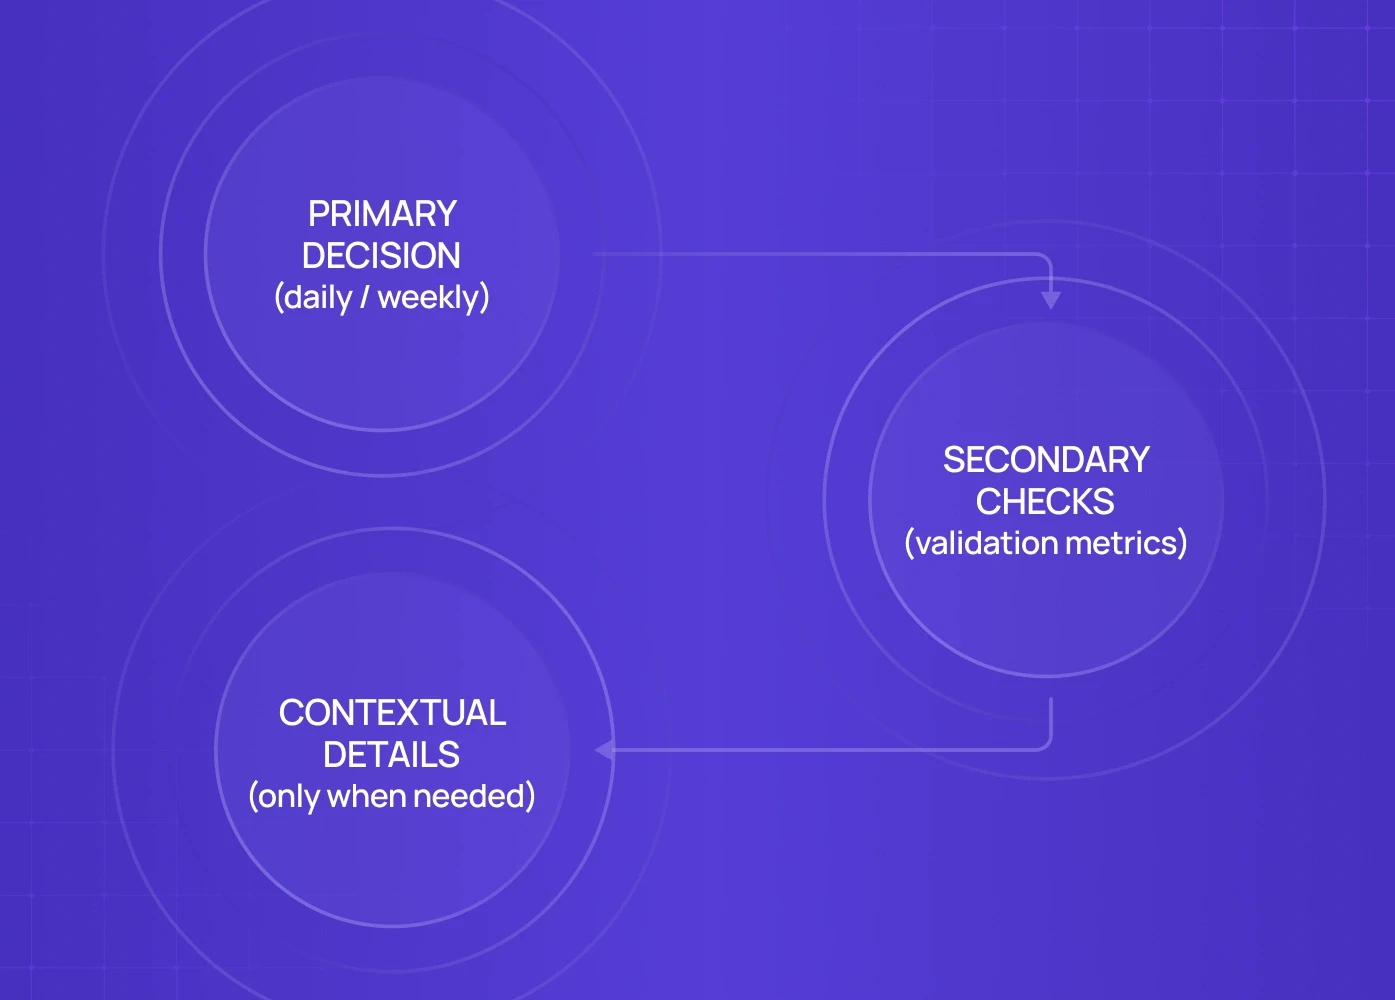
Practical framework
For each dashboard, define:
Primary decision (daily / weekly)
Secondary checks (validation metrics)
Contextual details (only when needed)
This approach dramatically improves complex UI simplification without removing power, and in usability tests it often cuts “time to first useful insight” from minutes to seconds.
2. Design Role-Based Dashboards (Not One-Size-Fits-All)
One of the biggest mistakes in B2B SaaS UI is giving every user the same dashboard. Admins, managers, and operators do not look for the same insights — and applying intelligent dashboard design principles is what allows teams to build role-adaptive interfaces that surface the right data to the right person without multiplying design complexity.
Admins, managers, and operators do not look for the same insights.
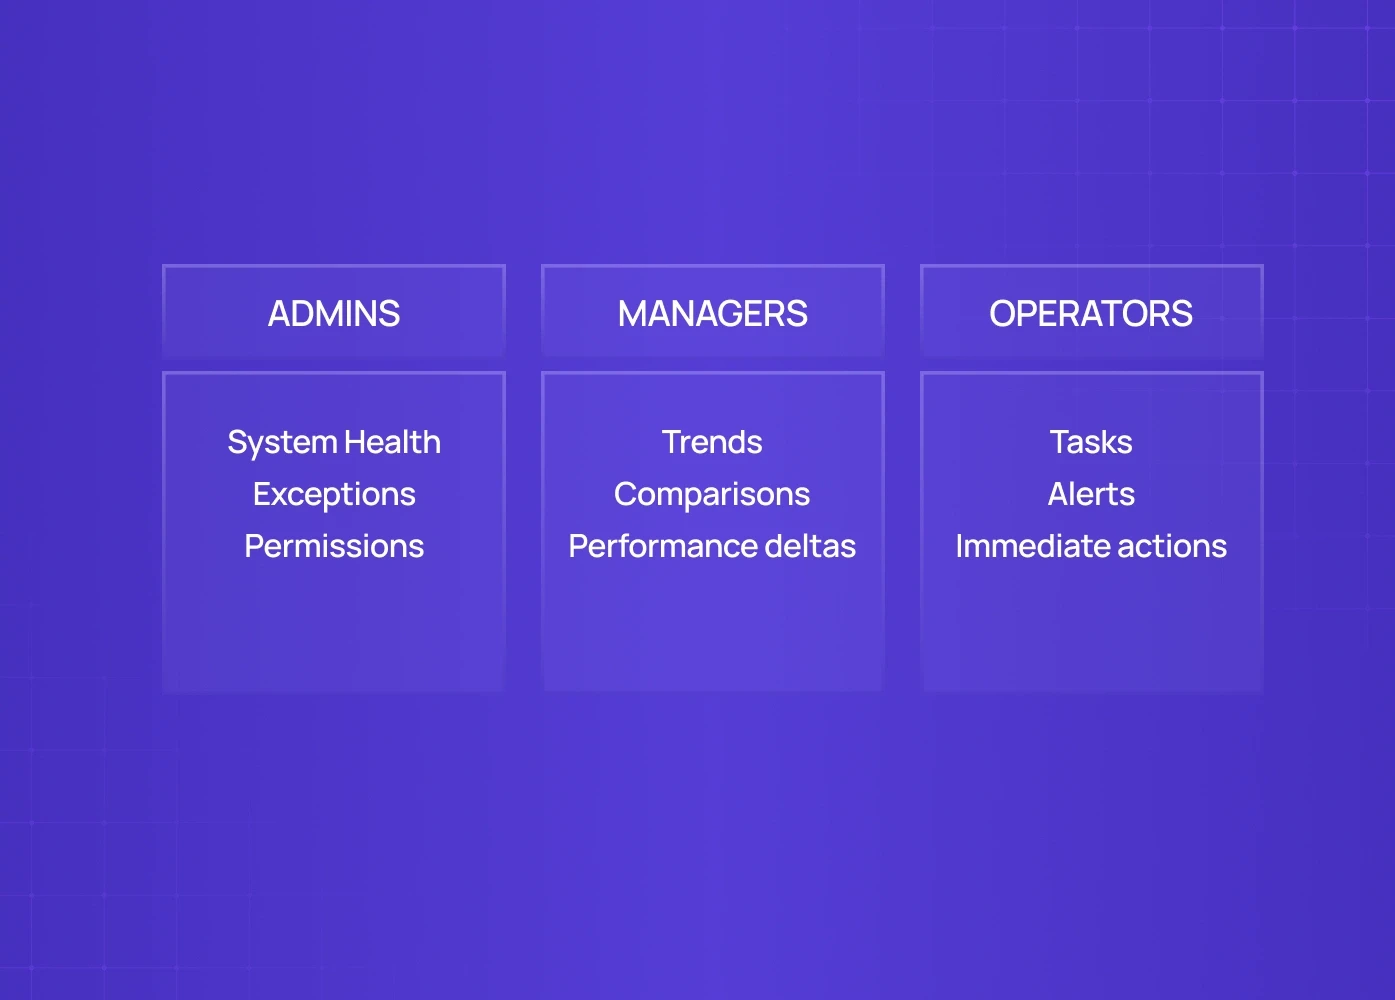
Best practice for admin dashboard UX
Admins → system health, exceptions, permissions
Managers → trends, comparisons, performance deltas
Operators → tasks, alerts, immediate actions
If your dashboard UX doesn’t adapt by role, users will either:
Ignore most widgets, or
Export data to spreadsheets (a clear UX failure)
In many B2B products, heavy export behavior is one of the clearest signals that the default dashboard isn't answering the right questions fast enough. Fintech dashboard UX sets the benchmark here — role-based views for relationship managers, compliance officers, and end customers have been standard practice in banking products long before SaaS caught up.
We applied this role-based dashboard logic while designing the PathwaysX B2B hiring platform, where admin, recruiter, and leadership views were intentionally separated to reduce decision fatigue and speed up daily actions.
3. Progressive Disclosure Beats Dense Layouts
A common myth in data-heavy UI design: “Power users want everything visible.”
Reality: Power users want fast answers, not clutter — and that expectation is shaped long before they reach the dashboard, which is why guided first login experiences that set accurate expectations upfront directly reduce the cognitive pressure users bring to data-heavy screens.
During the Gini health tracking redesign, progressive disclosure helped surface only the most relevant health insights upfront, with deeper breakdowns revealed on demand.
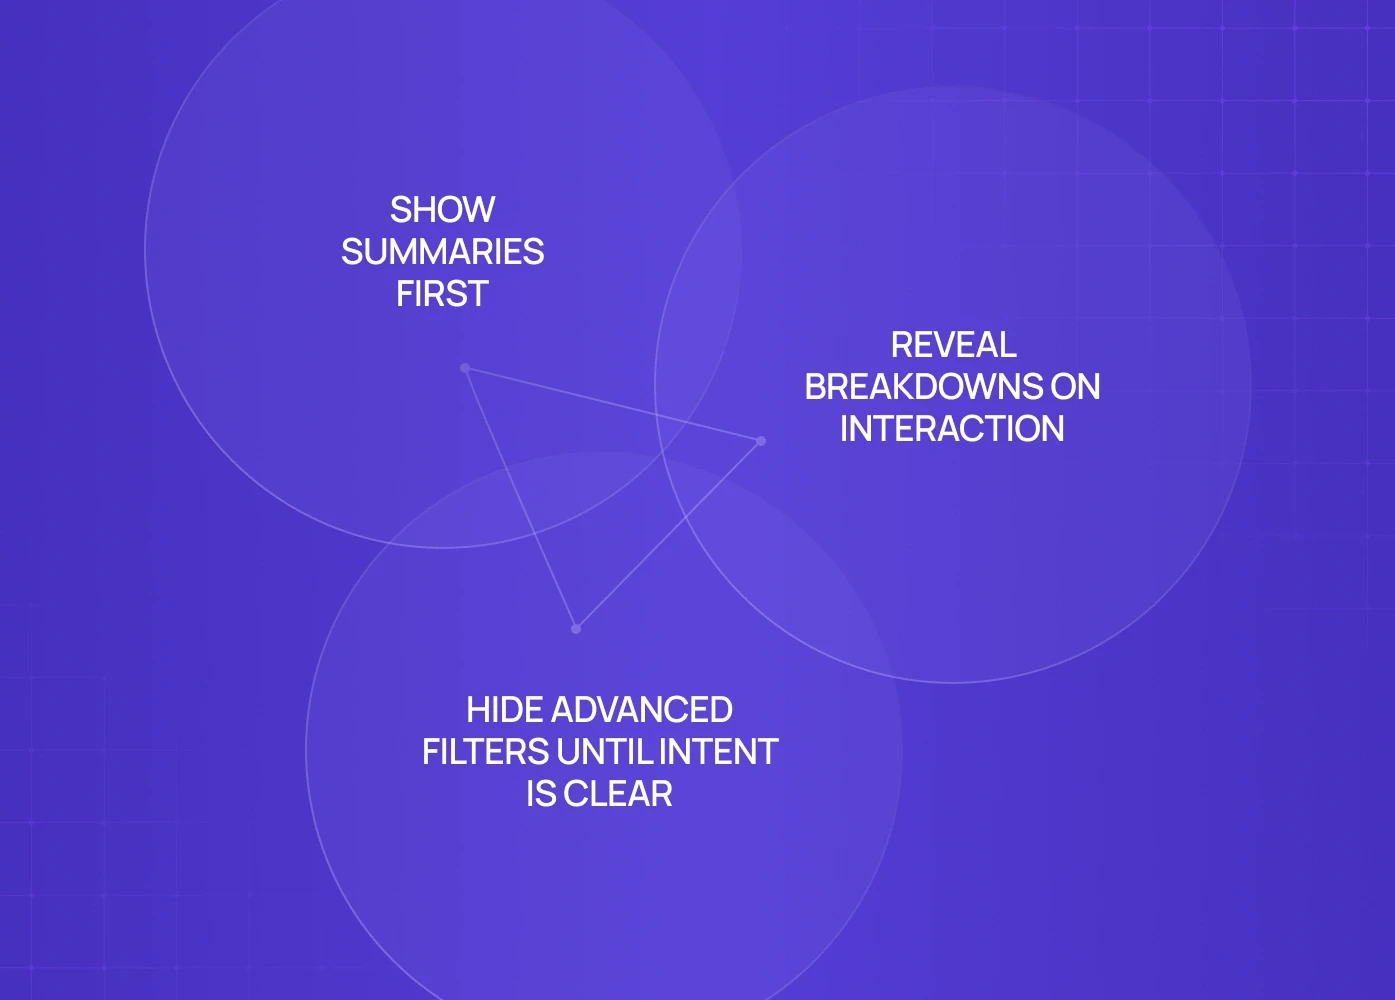
Progressive disclosure in analytics dashboard UX
Show summaries first
Reveal breakdowns on interaction
Hide advanced filters until intent is clear
This keeps dashboards usable for new users without limiting experts.
In moderated studies, dashboards that lead with summaries and hide advanced filters until needed are typically understood correctly on the first try far more often than dense, everything-at-once layouts.
4. Visual Hierarchy Is More Important Than Visual Style
Most dashboard redesigns obsess over colors and charts. What actually drives comprehension is hierarchy — a lesson fintech dashboard UX agencies learned early, since regulatory pressure leaves no room for ambiguous metric prioritisation.
Strong data visualization UX ensures: One dominant focal metric per section, Clear grouping of related data, Predictable scan paths. Tracking the right SaaS UX metrics tells you whether hierarchy changes are actually improving comprehension or just moving the furniture around. If all widgets scream for attention, users tune everything out.
5. Charts Don’t Explain Themselves (Context Is UX)
A chart without context is just decoration.
Effective screen design for dashboards always includes:
Plain-language labels
Short insight captions (“This dropped 12% vs last week”)
Benchmarks or comparisons
Never assume users know why a metric matters — a discipline that matters even more in AI SaaS dashboard design, where AI-generated insights need explicit context or users won't trust the number behind them.
6. Default States Matter More Than Filters
Most SaaS dashboards fail before users even interact.
Why? Because default states are overwhelming.
Dashboard usability best practice
Defaults should answer the most common question
Filters should refine, not rescue, the experience
If users must immediately adjust filters to make sense of data, the UX is broken. The same failure logic extends across the full product lifecycle — UI/UX design for SaaS from onboarding to retention shows how unclear defaults during onboarding create the same drop-off patterns that confusing dashboards create at the activation stage.
7. Empty States Are UX, Not Errors
In admin and analytics dashboards, empty states are inevitable — and they occur most often for users who completed a flawed SaaS product signup flow that skipped data connection steps entirely. Poor empty state: "No data available."
Effective empty state:
Explains why it’s empty
Shows what to do next
Sets expectation for future data
This is a critical but overlooked part of SaaS UI examples that actually convert.
8. Reduce Cognitive Load With “One Insight Per Screen”
Dashboards fail when they try to do too much at once.
A reliable rule for complex UI simplification:
One primary insight per screen or section.
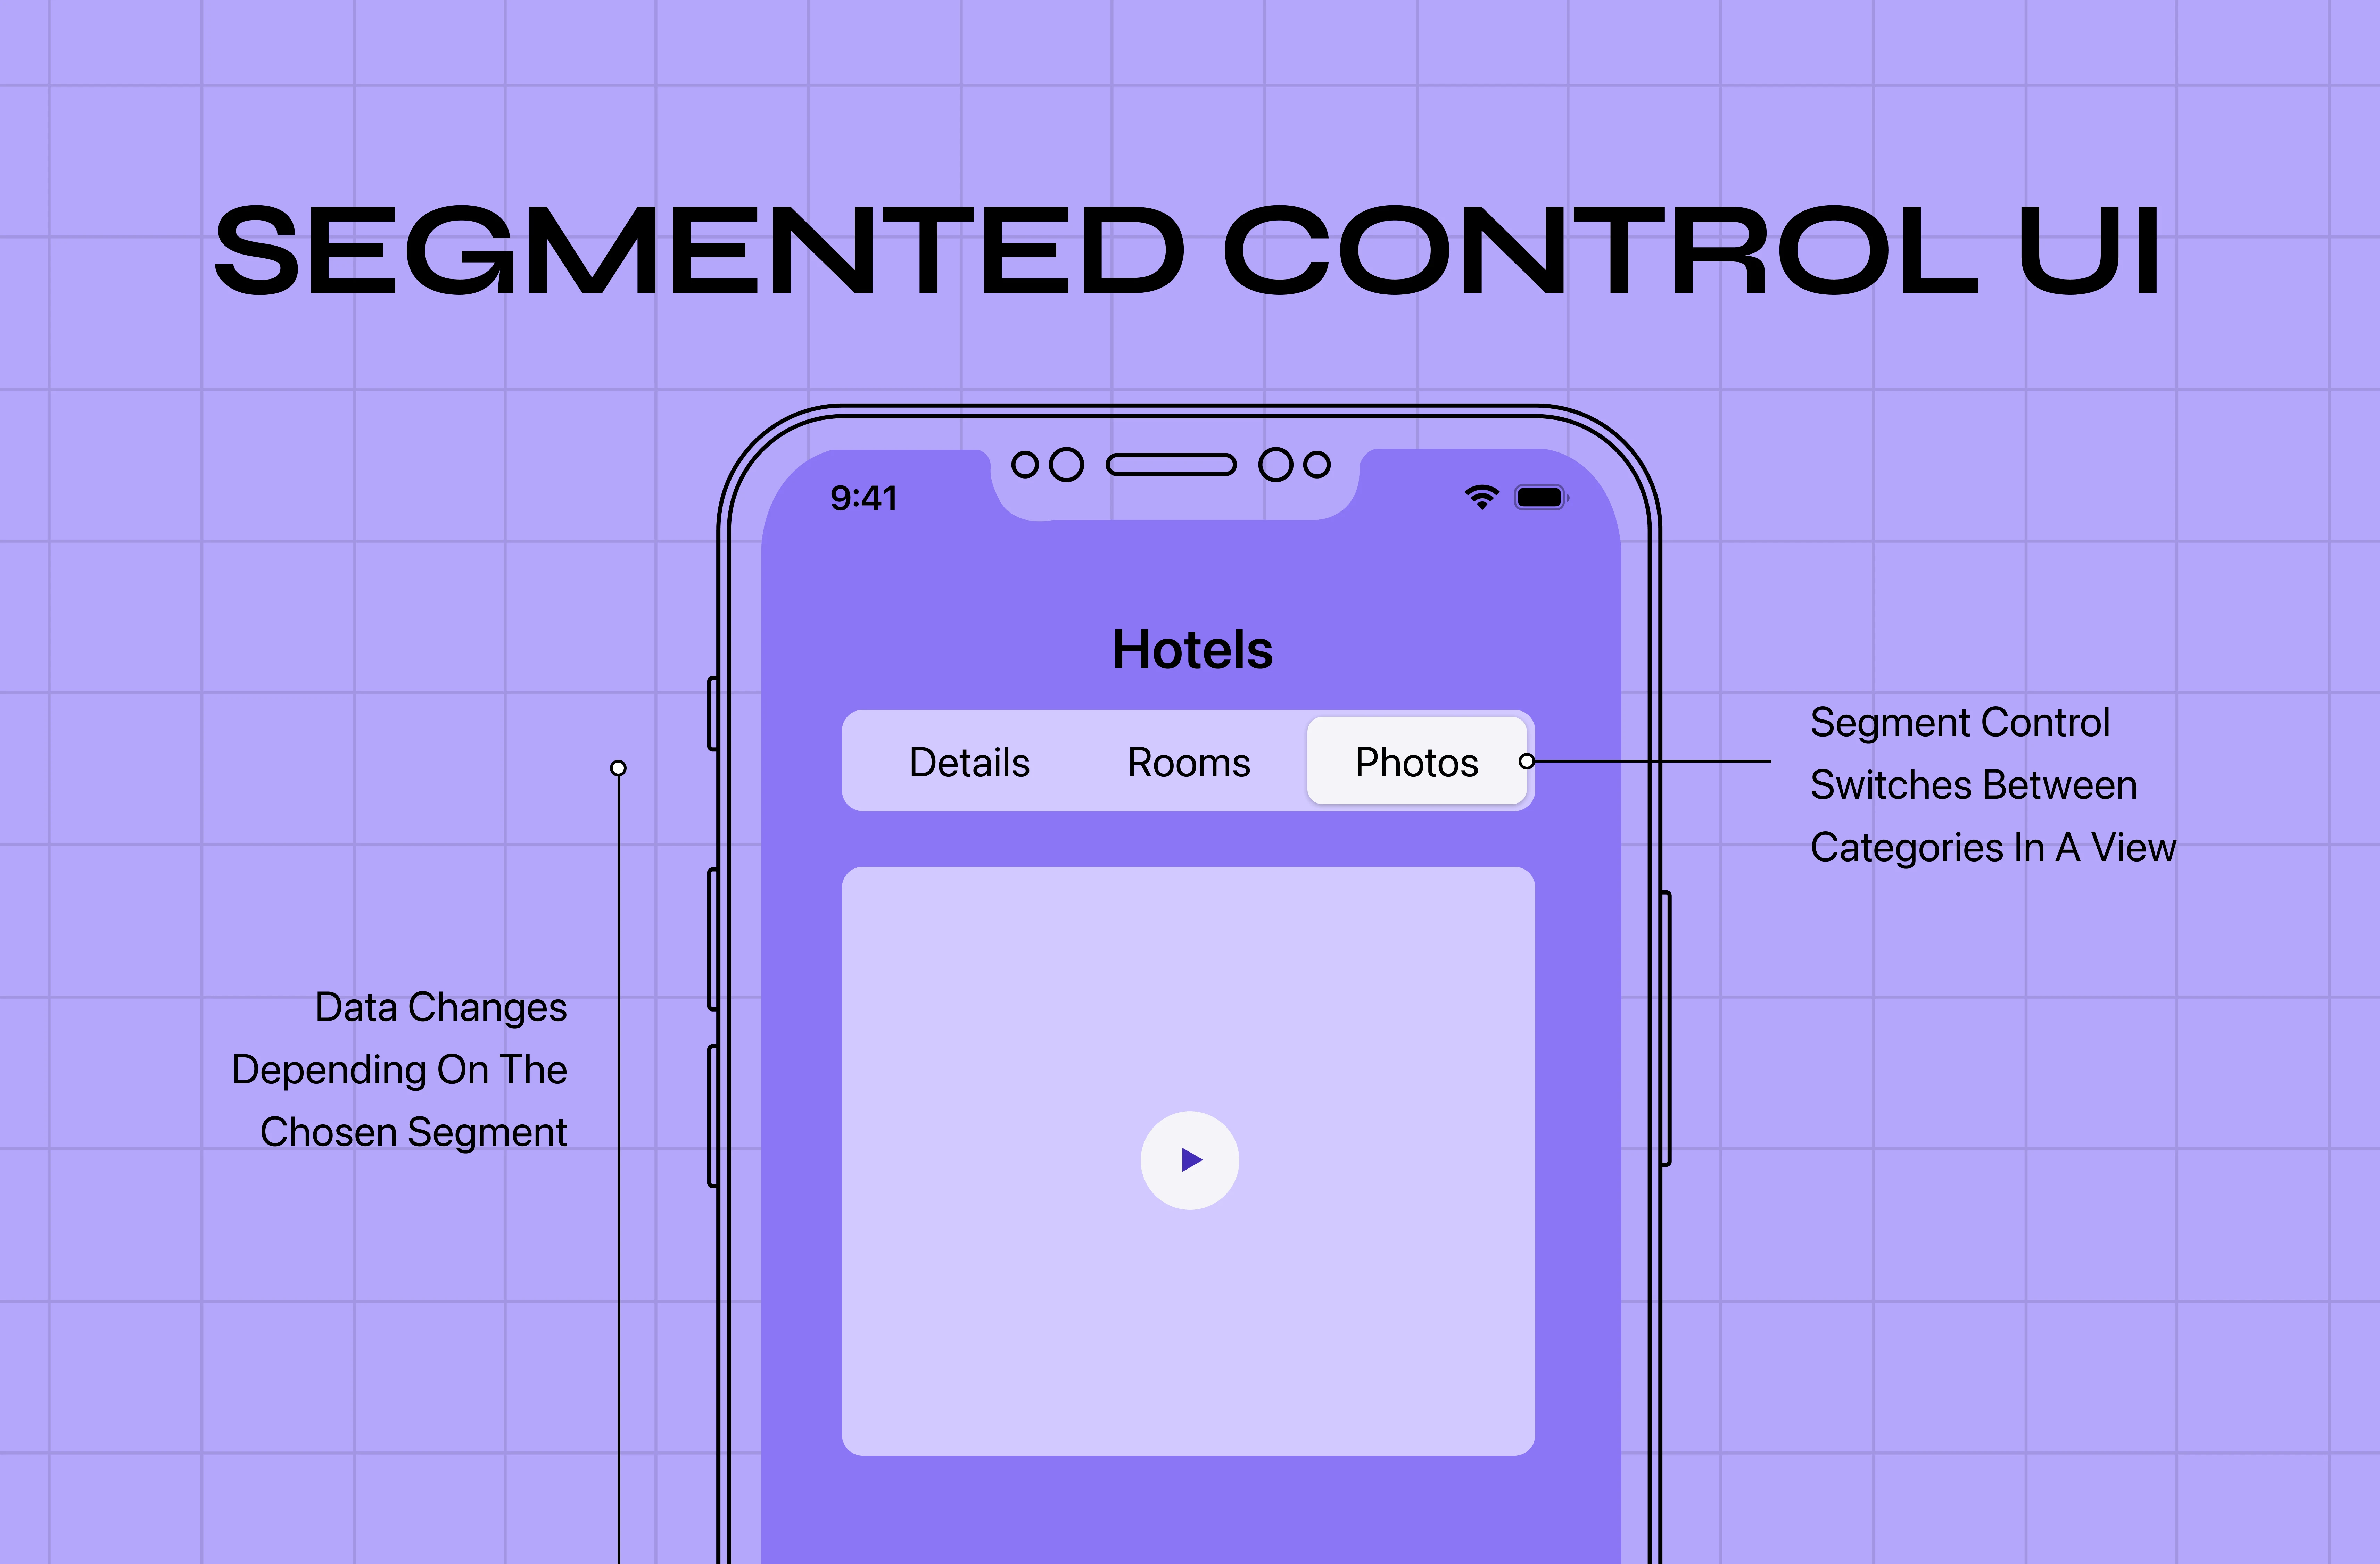
Secondary metrics should support the main story — not compete with it. Components like filter control patterns are where this rule gets tested — a poorly structured segmented control that surfaces too many equal-weight options at once breaks the one-insight rule before the user even reaches the data.
This is especially important in mobile and responsive dashboards.
9. Performance Is Dashboard UX (Not Engineering Only)
A slow dashboard feels broken — even if the data is accurate. Even a few extra seconds of perceived delay can push users to refresh, re‑run filters, or abandon the page, which quickly erodes trust.
In SaaS products:
Latency = uncertainty
Uncertainty = distrust
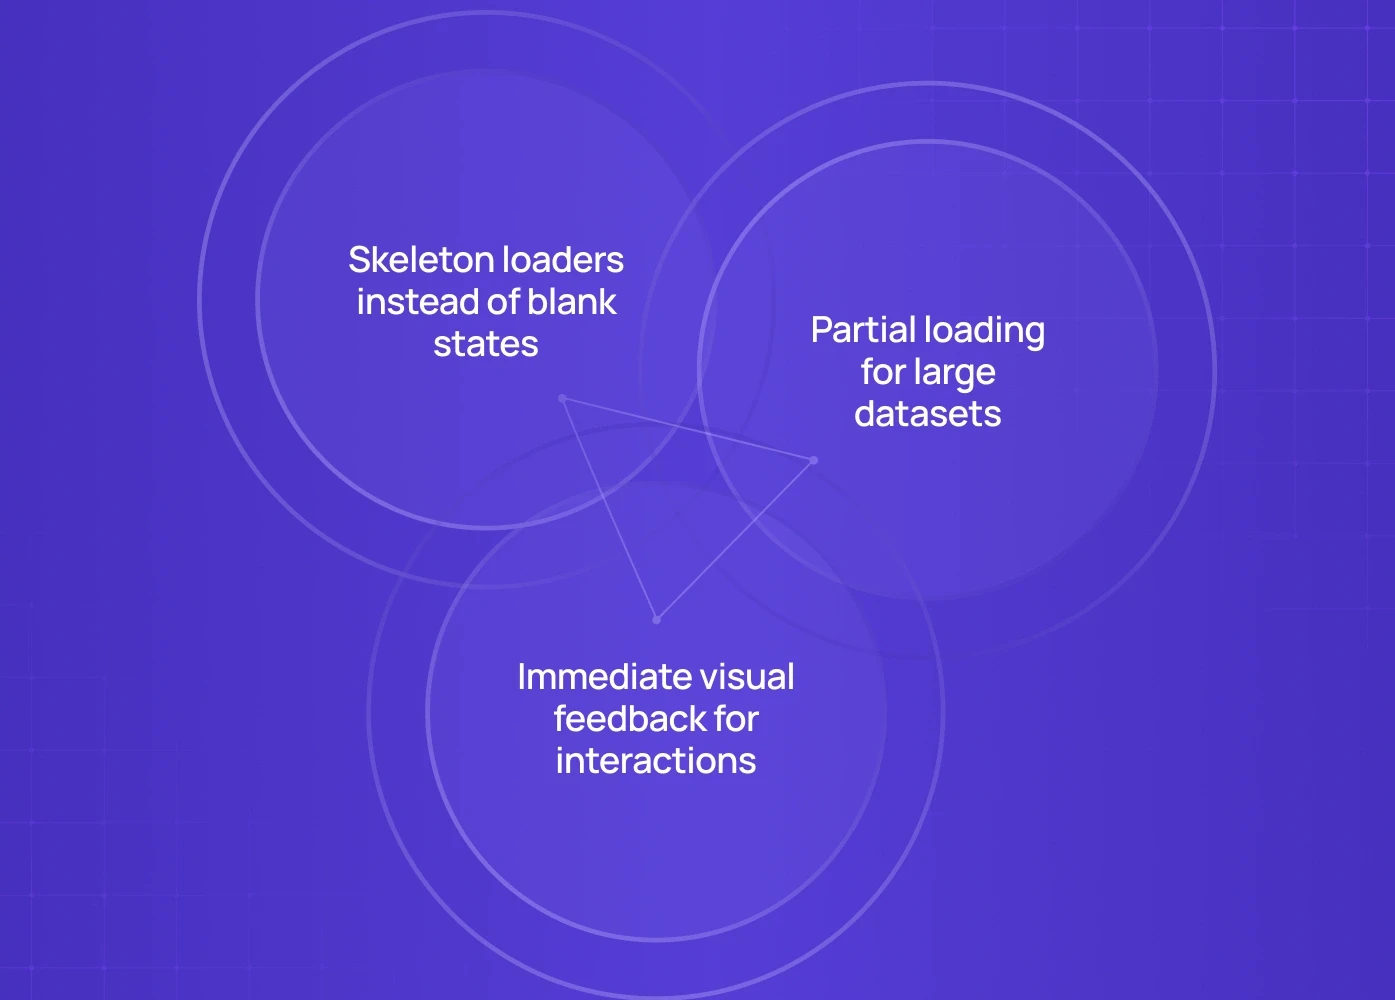
Best practice:
Skeleton loaders instead of blank states, partial loading for large datasets.
Immediate visual feedback for interactions.
These are classic micro UX design patterns — small, targeted interventions that eliminate perceived latency and rebuild user trust without touching the underlying data architecture.
10. Dashboards Should Suggest Actions, Not Just Show Data
The best SaaS dashboards answer: “So what should I do now?”
High-performing products embed:
Inline CTAs
Alerts tied to thresholds
Suggested next steps
This bridges the gap between analytics dashboard UX and real business outcomes. As dashboards become more intelligent and adaptive, teams are increasingly rethinking whether traditional UX patterns are enough — especially as AI-driven UX models change how users expect insights and recommendations to surface.
Common SaaS Dashboard UX Mistakes (We See These Constantly)
Too many KPIs without prioritization
Same dashboard for all roles
Overuse of charts where tables are clearer
Filters doing the heavy lifting instead of UX
Treating dashboards as reports, not tools
Fixing these alone can significantly improve adoption — and bad UX design examples and how to fix them shows how these same patterns appear across product types, making it easier to diagnose which mistake is costing you the most users before committing to a redesign.
How High-Performing Teams Approach SaaS Dashboard Design
Teams that get dashboards right follow a repeatable process: Define user roles & decisions, Map data to decisions (not features), Design progressive views, Validate comprehension with real users, Iterate based on usage patterns.
This is also why many teams eventually partner with specialised UX design companies for SaaS products when internal dashboards stop scaling with product complexity.
When to Rethink Your Dashboard UX
You likely need a dashboard UX overhaul if:
A high percentage of sessions end with data export instead of in‑product action
Support tickets ask “Where do I find…?”
New users still can’t explain the dashboard’s main value after several days or multiple logins
Metrics are viewed but not acted upon
These are UX problems — not user problems. And they are measurable ones: calculating the ROI of UX design gives teams the framework to quantify exactly how much dashboard confusion is costing in support load, feature abandonment, and stalled upgrades before presenting the case for a redesign.
Final Thought: Dashboards Should Feel Obvious
The best compliment a SaaS dashboard can get isn’t: “This looks great.”
It’s: “This makes sense immediately.”
If your dashboard reduces thinking, clarifies priorities, and nudges action — you've nailed SaaS dashboard design. And if it doesn't, no amount of new charts will fix it without first establishing a recurring dashboard refinement loop that retests comprehension as user roles and data complexity evolve.
Want to Improve Dashboard UX Without Guesswork?
If your SaaS dashboard feels powerful but underused, the issue is rarely data — it’s structure, hierarchy, and intent.
A focused UX audit can reveal:
Where users get stuck
Which metrics confuse instead of help
How to simplify without dumbing down
This is exactly where our SaaS UI/UX design services focus — diagnosing dashboard friction, simplifying data-heavy interfaces, and turning insights into actions.
Book a 20-minute dashboard UX teardown with our Creative Director and see exactly where users are getting confused — and what to fix first.