
Most SaaS founders track revenue. The best ones track what drives it — and what quietly kills it before the damage shows up in MRR. This guide covers the 12 metrics that separate compounding growth from a leaky bucket.
Most SaaS founders track revenue. The best ones track what drives it.

TL;DR
SaaS companies with NRR above 120% grow 2.5x faster than peers (ChartMogul, 2025)
Median NRR across B2B SaaS in 2025 is 106%; top performers exceed 130%
Average annual churn for B2B SaaS is 3.5% — top-performing companies stay below 3%
Best-in-class LTV:CAC ratio is 3:1 or higher; CAC payback under 12 months
Customer acquisition costs rose 14% in 2025 — making retention metrics more valuable than ever
Running a SaaS business without tracking the right numbers is like designing a product without user research — you're guessing, not building. SaaS companies operate on recurring revenue, which means performance doesn't show up cleanly on a traditional P&L. The numbers that matter most — churn, retention, acquisition efficiency — live outside conventional financial reporting.
That's what SaaS metrics exist to solve. They give founders, operators, and investors a shared language for evaluating business health: not just whether you're making money, but whether you're making it sustainably.
This guide covers the metrics that matter most, how to calculate them, and what they're actually telling you.
What Are SaaS Metrics?
SaaS metrics are performance indicators built specifically for subscription-based software businesses. Unlike traditional retail or e-commerce, SaaS companies earn revenue across a customer lifecycle — acquisition, renewal, and expansion — which means performance needs to be measured across all three stages, not just at the point of sale.
The right metrics reveal whether your product is retaining customers, whether your pricing is working, and whether your growth is efficient or expensive. Tracked consistently, they become the foundation for forecasting, fundraising, and strategic decisions.
Not every metric matters equally at every stage. Early-stage companies lean heavily on acquisition and cash flow metrics. Growth-stage companies shift focus toward retention and expansion. What's constant is the need for accurate, repeatable measurement.
Why Choosing the Right Metrics Matters
With hundreds of metrics available, the risk isn't a lack of data — it's tracking the wrong things. A metric only becomes useful when it connects to a decision you can act on.
A few principles to guide selection:
Align metrics to your current goal. Scaling acquisition? Track CAC and activation rate. Reducing churn? Watch NRR and customer retention rate.
Factor in your billing model. Monthly billing makes MRR your primary revenue signal. Annual contracts shift focus to ACV and ARR.
Revisit your metric stack as you grow. What mattered at 100 customers may not matter at 10,000 — the same logic applies to inclusive design investment, where benchmarking against an accessibility maturity benchmark helps teams recognize when compliance-level accessibility needs to evolve into a structural product commitment as the user base scales.
12 Key SaaS Metrics, Grouped by Function
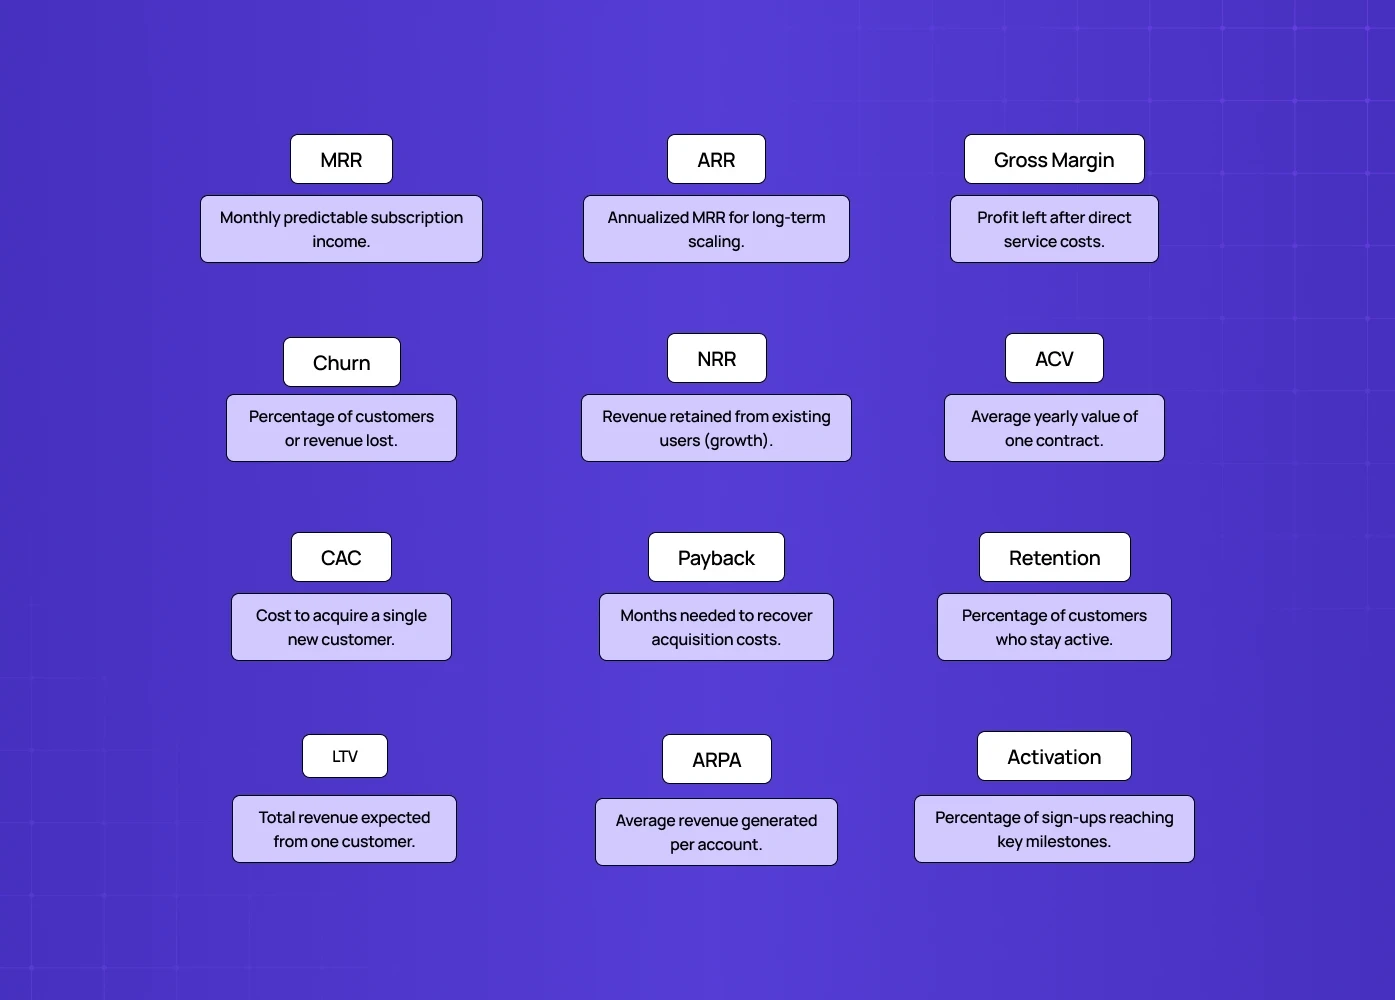
Revenue and Financial Health
1. Monthly Recurring Revenue (MRR)
MRR measures the predictable income your business earns from active subscriptions each month. It's the single most important revenue signal for companies on monthly billing plans.
Formula: Total active accounts × average revenue per account
Example: 1,000 customers paying $100/month = $100,000 MRR
Why it matters: MRR is your baseline for month-over-month growth tracking. Investors use it to assess revenue stability. Internal teams use it to set budgets and sales targets.
2. Annual Recurring Revenue (ARR)
ARR is MRR scaled to a 12-month view. It's the primary revenue metric for companies with annual contracts or investors evaluating long-term scalability.
Formula: MRR × 12
Example: $100,000 MRR = $1.2M ARR
Why it matters: ARR is the number most cited in SaaS fundraising conversations. It signals the size and stability of your recurring revenue base.
According to SaaS Capital, 2025, median ARR growth across bootstrapped SaaS companies is 23% annually, while VC-backed companies hit 25%. In 2026, the overall median growth rate has settled at 26%, with top-quartile performers hitting approximately 50% YoY growth.
3. Gross Margin
Gross margin is the percentage of revenue remaining after subtracting direct costs — hosting, support infrastructure, third-party tools.
Formula: (Revenue − Cost of Goods Sold) ÷ Revenue × 100
Example: $200K revenue, $40K COGS = 80% gross margin
Why it matters: Healthy SaaS businesses typically run at 70–85% gross margin. Anything below 70% signals that infrastructure costs are eroding profitability — an area where SaaS application development decisions around architecture and third-party tooling have a direct and compounding effect on your margin over time. High gross margin gives you room to reinvest in growth.
4. Annual Contract Value (ACV)
ACV measures the average yearly revenue from a single customer contract. It normalizes revenue across deals of different lengths and is especially useful when your sales team closes a mix of one-year and multi-year contracts.
Formula: Total contract value ÷ contract length in years
Example: A 3-year contract worth $36,000 = $12,000 ACV
Why it matters: ACV helps compare deal sizes on equal footing, guiding sales prioritization and revenue forecasting — and it tends to run higher among vertical SaaS companies, where industry-specific depth often commands larger per-customer contracts.
Customer Retention and Expansion
5. Churn Rate
Churn rate is the percentage of customers — or revenue — lost within a given period. It's one of the clearest signals of product-market fit and customer satisfaction.
Formula: (Customers lost ÷ customers at start of period) × 100
Example: 20 customers lost from a base of 400 = 5% churn rate
Why it matters: Most healthy SaaS businesses report churn between 5–7% annually. Even a 1–2% monthly churn compounds into serious revenue loss over time. Reducing churn by 5% can meaningfully boost long-term profitability.
Revenue churn is equally important — losing one $10,000/month customer is categorically different from losing ten $100/month accounts, even if the customer count looks the same.
The average annual churn rate for B2B SaaS in 2025 is 3.5%, with top-performing companies staying consistently below 3%. In monthly terms, anything above 2% for SMB-focused products or above 1% for enterprise warrants immediate attention.
6. Net Revenue Retention (NRR)
NRR measures how much recurring revenue you retain from existing customers over a period — accounting for upgrades, downgrades, and cancellations. It's widely considered the benchmark metric for SaaS business health.
Formula: (Starting MRR + Expansion MRR − Churned MRR − Contraction MRR) ÷ Starting MRR × 100
Example: Start at $100K MRR, add $15K from upgrades, lose $10K from churn = 105% NRR
Why it matters: An NRR above 100% means your existing customer base is growing on its own — and it's one of the metrics most directly shaped by product and UX investment, which the complete guide to SaaS UX design covers from retention strategy through to expansion mechanics. Industry benchmarks suggest aiming for at least 109%. The largest recent SaaS IPOs — Snowflake, Twilio, Elastic — all had NRRs above 140%.
According to ChartMogul (2025), SaaS companies with NRR above 120% grow 2.5 times faster than companies with NRR below 100%.
7. Customer Retention Rate
Customer retention rate measures the percentage of customers who stay with you over a given period — and it begins accumulating before the product is even used, which is why SaaS signup conversion UX sets the baseline expectation that either supports or undermines long-term retention from day one. It's the complement to churn — where churn shows loss, retention shows durability.
Formula: ((Customers at end of period − New customers acquired) ÷ Customers at start of period) × 100
Example: Start with 500, gain 100, end with 550 = 90% retention rate
Why it matters: Retention above 85% is common in healthy SaaS businesses. Strong retention compounds over time — it builds a stable revenue base that reduces your dependence on constant acquisition.
8. Customer Lifetime Value (LTV)
LTV is the total revenue your business can expect from a single customer over the full duration of their relationship with you.
Formula: Average revenue per account ÷ Churn rate
Example: $50 ARPA ÷ 0.03 churn rate = $1,667 LTV
Why it matters: LTV gives context to CAC. The standard benchmark is a 3:1 LTV-to-CAC ratio — for every $1 spent acquiring a customer, you should expect $3 in lifetime return. A company with $36 CAC and $1,667 LTV is in a very strong position.
Acquisition and Efficiency
9. Customer Acquisition Cost (CAC)
CAC is the total sales and marketing spend required to bring on one new customer within a given period.
Formula: Total sales and marketing spend ÷ Number of new customers acquired
Example: $18,000 spend ÷ 500 new customers = $36 CAC
Why it matters: CAC is a direct measure of how efficiently you're growing. Investors favor lower CAC. Combined with LTV and payback period, it tells the full story of acquisition efficiency — a story that begins with the channels and pricing decisions built into your SaaS go-to-market strategy, which set the ceiling on how low CAC can realistically go. A SaaS product with genuinely clear UX and strong onboarding naturally lowers CAC by reducing the sales effort required to convert.
Customer acquisition costs rose 14% in 2025 (Lighter Capital), making the LTV:CAC ratio more important to monitor than CAC in isolation.
This is something Groto actively designs for. When we redesigned Camb.ai's platform — a real-time AI dubbing tool serving 140+ languages — the focus was on reducing friction in the user journey. Cleaner UI meant fewer support touchpoints, which directly reduced the cost of converting and retaining users.
10. CAC Payback Period
The payback period measures how long it takes a new customer to generate enough revenue to cover their acquisition cost.
Formula: CAC ÷ Monthly recurring revenue per customer
Example: $1,200 CAC ÷ $200 MRR per customer = 6-month payback
Why it matters: Healthy SaaS companies target a payback period under 12 months. A shorter payback period means faster reinvestment into growth. This metric is particularly critical for startups managing cash flow in the early stages.
Companies with ACV above $100,000 carry a median payback of 24 months; those with ACV under $5,000 average 9 months (Financial Models Lab, 2025). The key benchmark is whether payback is improving quarter over quarter, not the absolute number.
11. Average Revenue Per Account (ARPA)
ARPA measures the revenue generated per customer account in a given month. It accounts for the fact that customers may have multiple users or varied usage tiers under one account.
Formula: MRR ÷ Number of active accounts
Example: $50,000 MRR ÷ 1,000 accounts = $50 ARPA
Why it matters: A declining ARPA signals that newer customers are less valuable than your existing base — a pricing or positioning problem worth investigating early.
12. Activation Rate
Activation rate tracks the percentage of signed-up users who complete a meaningful action — typically converting from a free trial to a paid subscription.
Formula: (Users who activated ÷ Users who signed up) × 100
Example: 700 conversions from 1,000 trial sign-ups = 70% activation rate
Why it matters: Activation rate is a direct measure of onboarding quality. A low rate often points to UX friction, unclear value communication, or a misaligned free-to-paid experience. Fixing the onboarding flow is frequently the highest-ROI intervention for early-stage SaaS products — and A/B testing for SaaS companies is how you validate which specific changes move activation before committing them to the full user base.
When Groto worked with PolicyBazaar, improving the mobile onboarding experience — reducing drop-offs and streamlining sign-up steps — had a measurable impact on conversion. The design work wasn't cosmetic; it moved a metric that directly affects revenue.
How to Actually Improve Your SaaS Metrics
Tracking metrics is step one. Acting on them is where the value is.
Low MRR or declining ARPA: Survey users on pricing. Explore tiered plans or annual billing to improve cash flow predictability.
High churn rate: Invest in customer success processes and conduct exit interviews. Churn is often a product feedback signal before it's a sales problem — if the pattern persists across cohorts, it's worth assessing when to redesign your SaaS UX/UI rather than continuing to optimize an experience that's structurally misaligned.
Weak NRR: Focus on expansion revenue — upgrades, cross-sells, usage-based billing. NRR above 100% means your existing base funds growth without constant acquisition.
High CAC or long payback period: Audit your onboarding and activation flow. Design quality directly reduces sales friction — and for AI-powered products specifically, AI product activation requires additional onboarding design investment because users must understand model behaviour before they trust the product enough to convert without hand-holding.
Low activation rate: Run usability tests, simplify the first-use experience, and look at where users drop out of the funnel. This is fundamentally a UX problem, not a marketing one — and fixing SaaS onboarding drop-offs with UX is where
most early-stage SaaS products find their highest-leverage intervention.
LTV below 3× CAC: Prioritize retention investment before scaling acquisition. Growing a leaky bucket faster doesn't fix the leak.
Which Metrics Should You Prioritize by Stage?
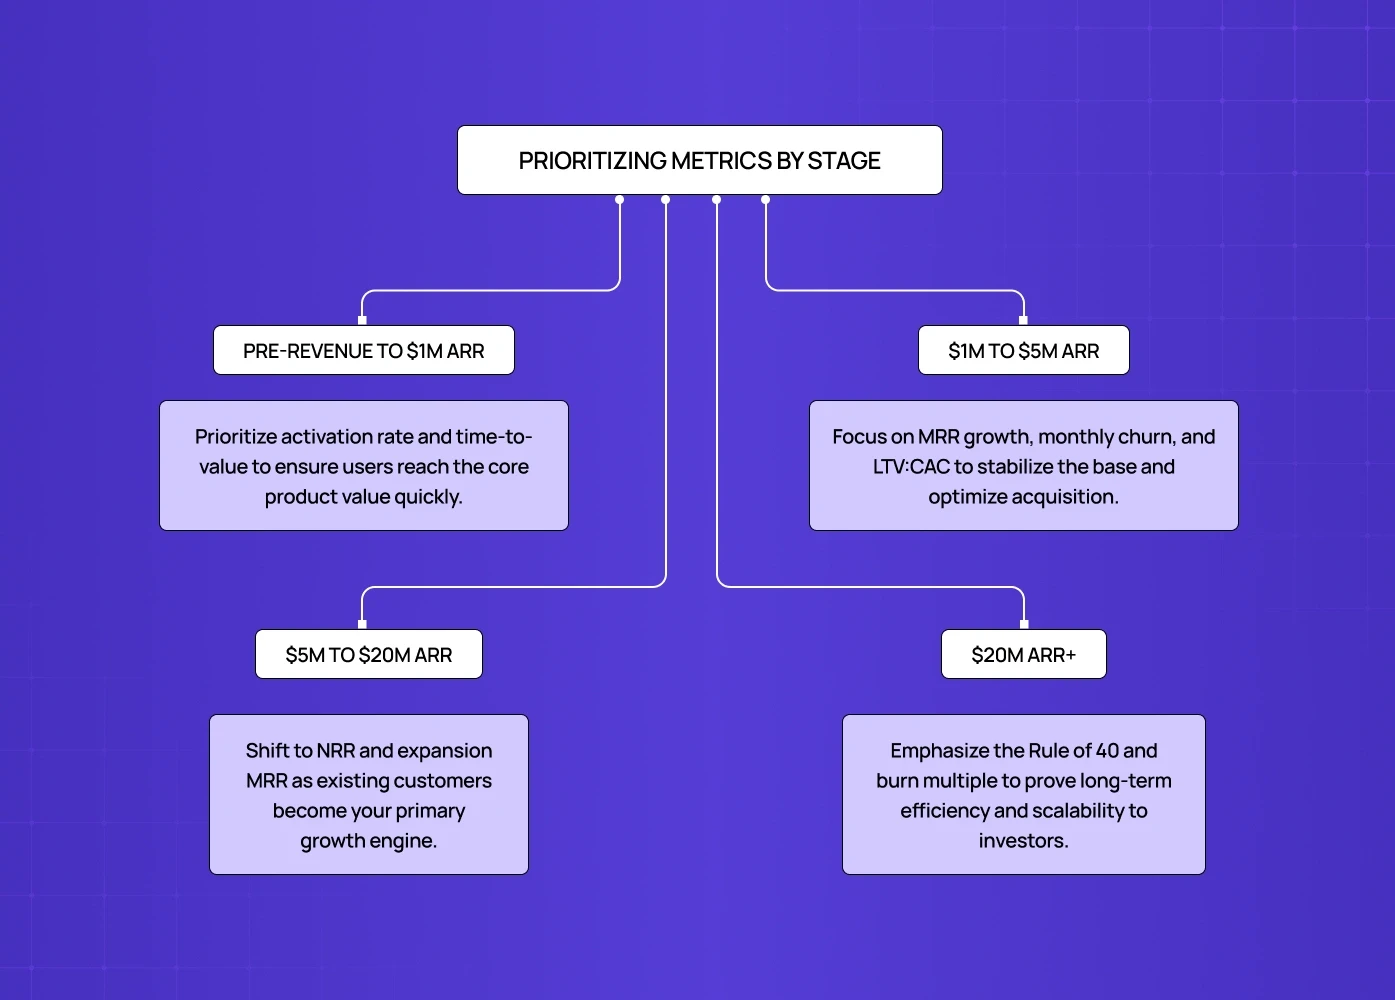
Research suggests 8–15 metrics are needed for a complete view of SaaS business health — but tracking all of them equally at every stage is where most founders go wrong. The metrics that matter most shift significantly as you scale.
A common mistake is tracking all 12 metrics equally regardless of company stage. The right metrics depend on where you are — because the biggest lever at $500K ARR is different from the biggest lever at $10M ARR.
Pre-revenue to $1M ARR: Focus on activation rate and time-to-value. You don't yet have enough customers to measure churn accurately, but you can observe whether users reach the core value moment in their first session — and MVP UX decisions that affect SaaS metrics covers how the design and flow choices made at this stage set the ceiling on how high activation rate can realistically climb before a structural redesign becomes necessary.
$1M to $5M ARR: MRR growth rate, monthly churn, and LTV:CAC ratio. At this stage, 5% monthly churn compounds to 46% annual churn — meaning you're replacing nearly half your customer base every year.
$5M to $20M ARR: NRR becomes your primary metric. Add expansion MRR tracking and CAC payback by channel. At this stage, 40% of growth already comes from existing customers — making feature adoption and onboarding depth a direct revenue lever, not a support function. Applying current SaaS product design best practices to how features are introduced and surfaced is what determines whether that adoption actually follows.
$20M ARR and above: Rule of 40 and burn multiple take center stage alongside NRR. Investors evaluate efficiency at this scale, not just growth.
How UI/UX Design Directly Affects Your SaaS Metrics
The metrics in this guide don't exist in isolation — they're downstream of product decisions. And few product decisions have more measurable impact than design.
Activation rate is almost always a UX problem first. If users sign up and don't convert, the funnel isn't broken — the first-use experience is.
Churn rate is often a usability signal before it's a satisfaction one. Users don't always complain; they just leave.
CAC drops when your product sells itself. A clear interface with intuitive onboarding reduces the sales and support effort required to convert and retain users.
NRR improves when users find expanding their usage natural — which is a product design challenge as much as a commercial one. UI UX design for SaaS products from onboarding to retention is the discipline that determines whether that expansion path feels intuitive or requires a sales conversation to unlock.
This is why design isn't cosmetic in SaaS. It's operational. The way a product looks and behaves directly determines whether users stay, upgrade, and refer — all of which show up in your numbers. The ROI of UX design gives you the frameworks to attach dollar values to those outcomes and make the case to stakeholders who think in revenue terms.
Building a SaaS Metrics Dashboard
The most useful SaaS metrics dashboard isn't the one with the most data — it's the one that surfaces the right signals for your current growth stage.
For early-stage companies, a dashboard should prioritize: MRR, CAC, payback period, activation rate, and churn rate. As you scale, layer in NRR, LTV, expansion revenue, and ARPA trends.
The design of how you see your data matters. A well-structured dashboard — clean hierarchy, logical groupings, clear visual relationships between metrics — makes it easier for teams to spot anomalies and act quickly. SaaS UX best practices for designing dashboards users actually understand go deeper on the specific layout decisions that make metrics actionable rather than decorative.This is the kind of thinking Groto brings to SaaS product design: the interface is always in service of decision-making.